Embedding Dashboards into your Application
Version Compatibility Notice
The content of this article is valid for the version of GoodData that was current as of 11 February 2021. Features or behavior in newer versions may differ.
Introduction
This article will review how to embed GoodData analytics into your application via iframes. In HTML, an iframe provides for a frame to be placed inside the body of a document. It lets you build user experiences into embeddable ‘cross-domain components’, which let users interact with other sites without being redirected. While iframes may have some disadvantages (such as slower initial load), they often serve as the easiest and fastest way to achieve the desired result with minimal coding.
What’s the story?
Let’s assume there’s an application with a particular look and feel that your users are accustomed to. It contains some basic charts and works fine, but any time your PMs or customers request a change, you need developers to change the code, which often takes quite a lot of time and effort. What you need is a simple-to-use GUI that will allow anybody—even your customers—to make the changes easily.
The aim of this exercise is to replace the hardcoded table and the two charts with a customizable embedded Dashboard that maintains the same look and feel and preserves the filtering capabilities of the whole environment.
Implementation
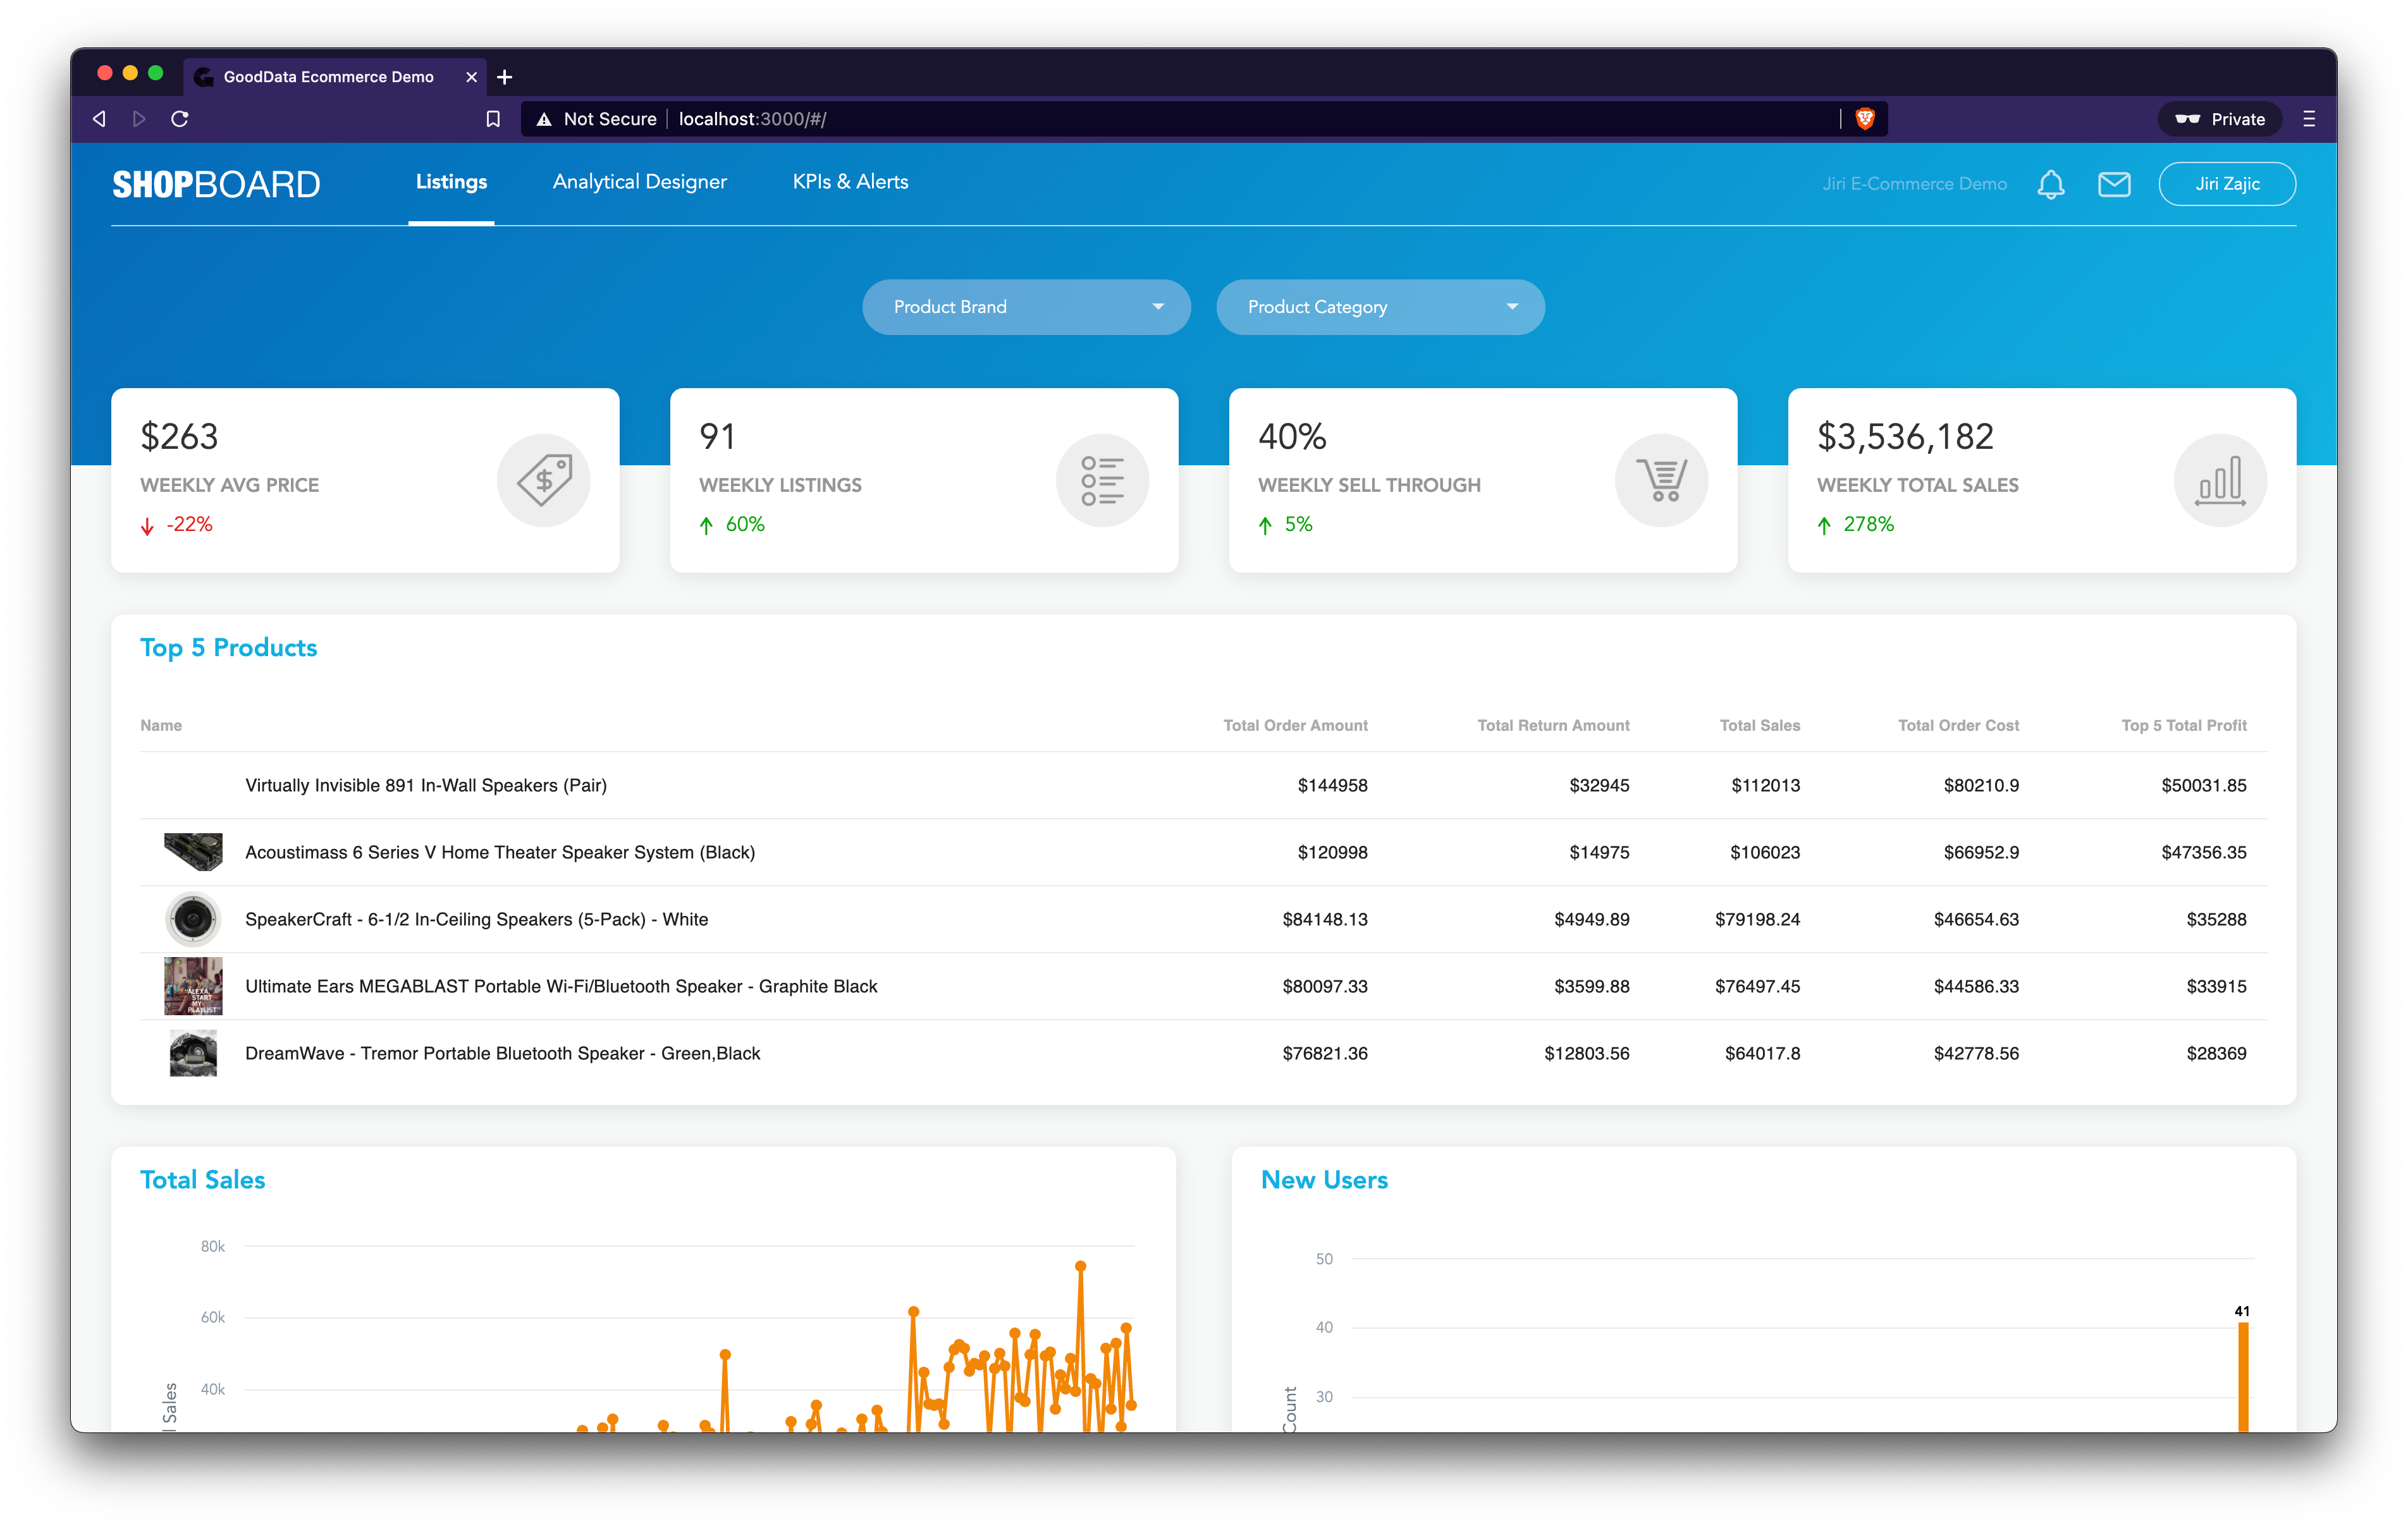
This could be a very simplified source code of the current state of the application:
<MyPage>
  <AttributeDropdown attribute={PRODUCT_BRAND} />
  <AttributeDropdown attribute={PRODUCT_CATEGORY} />
  <Kpi measure={AVG_PRICE_OF_PRODUCTS} />
  <Kpi measure={TOTAL_LISTINGS} />
  <Kpi measure={PERC_SELL_THROUGH} />
  <Kpi measure={TOTAL_SALES} />
  <CustomTable />
  <LineChart />
  <ColumnChart />
  <GeoPushpinChart />
</MyPage>
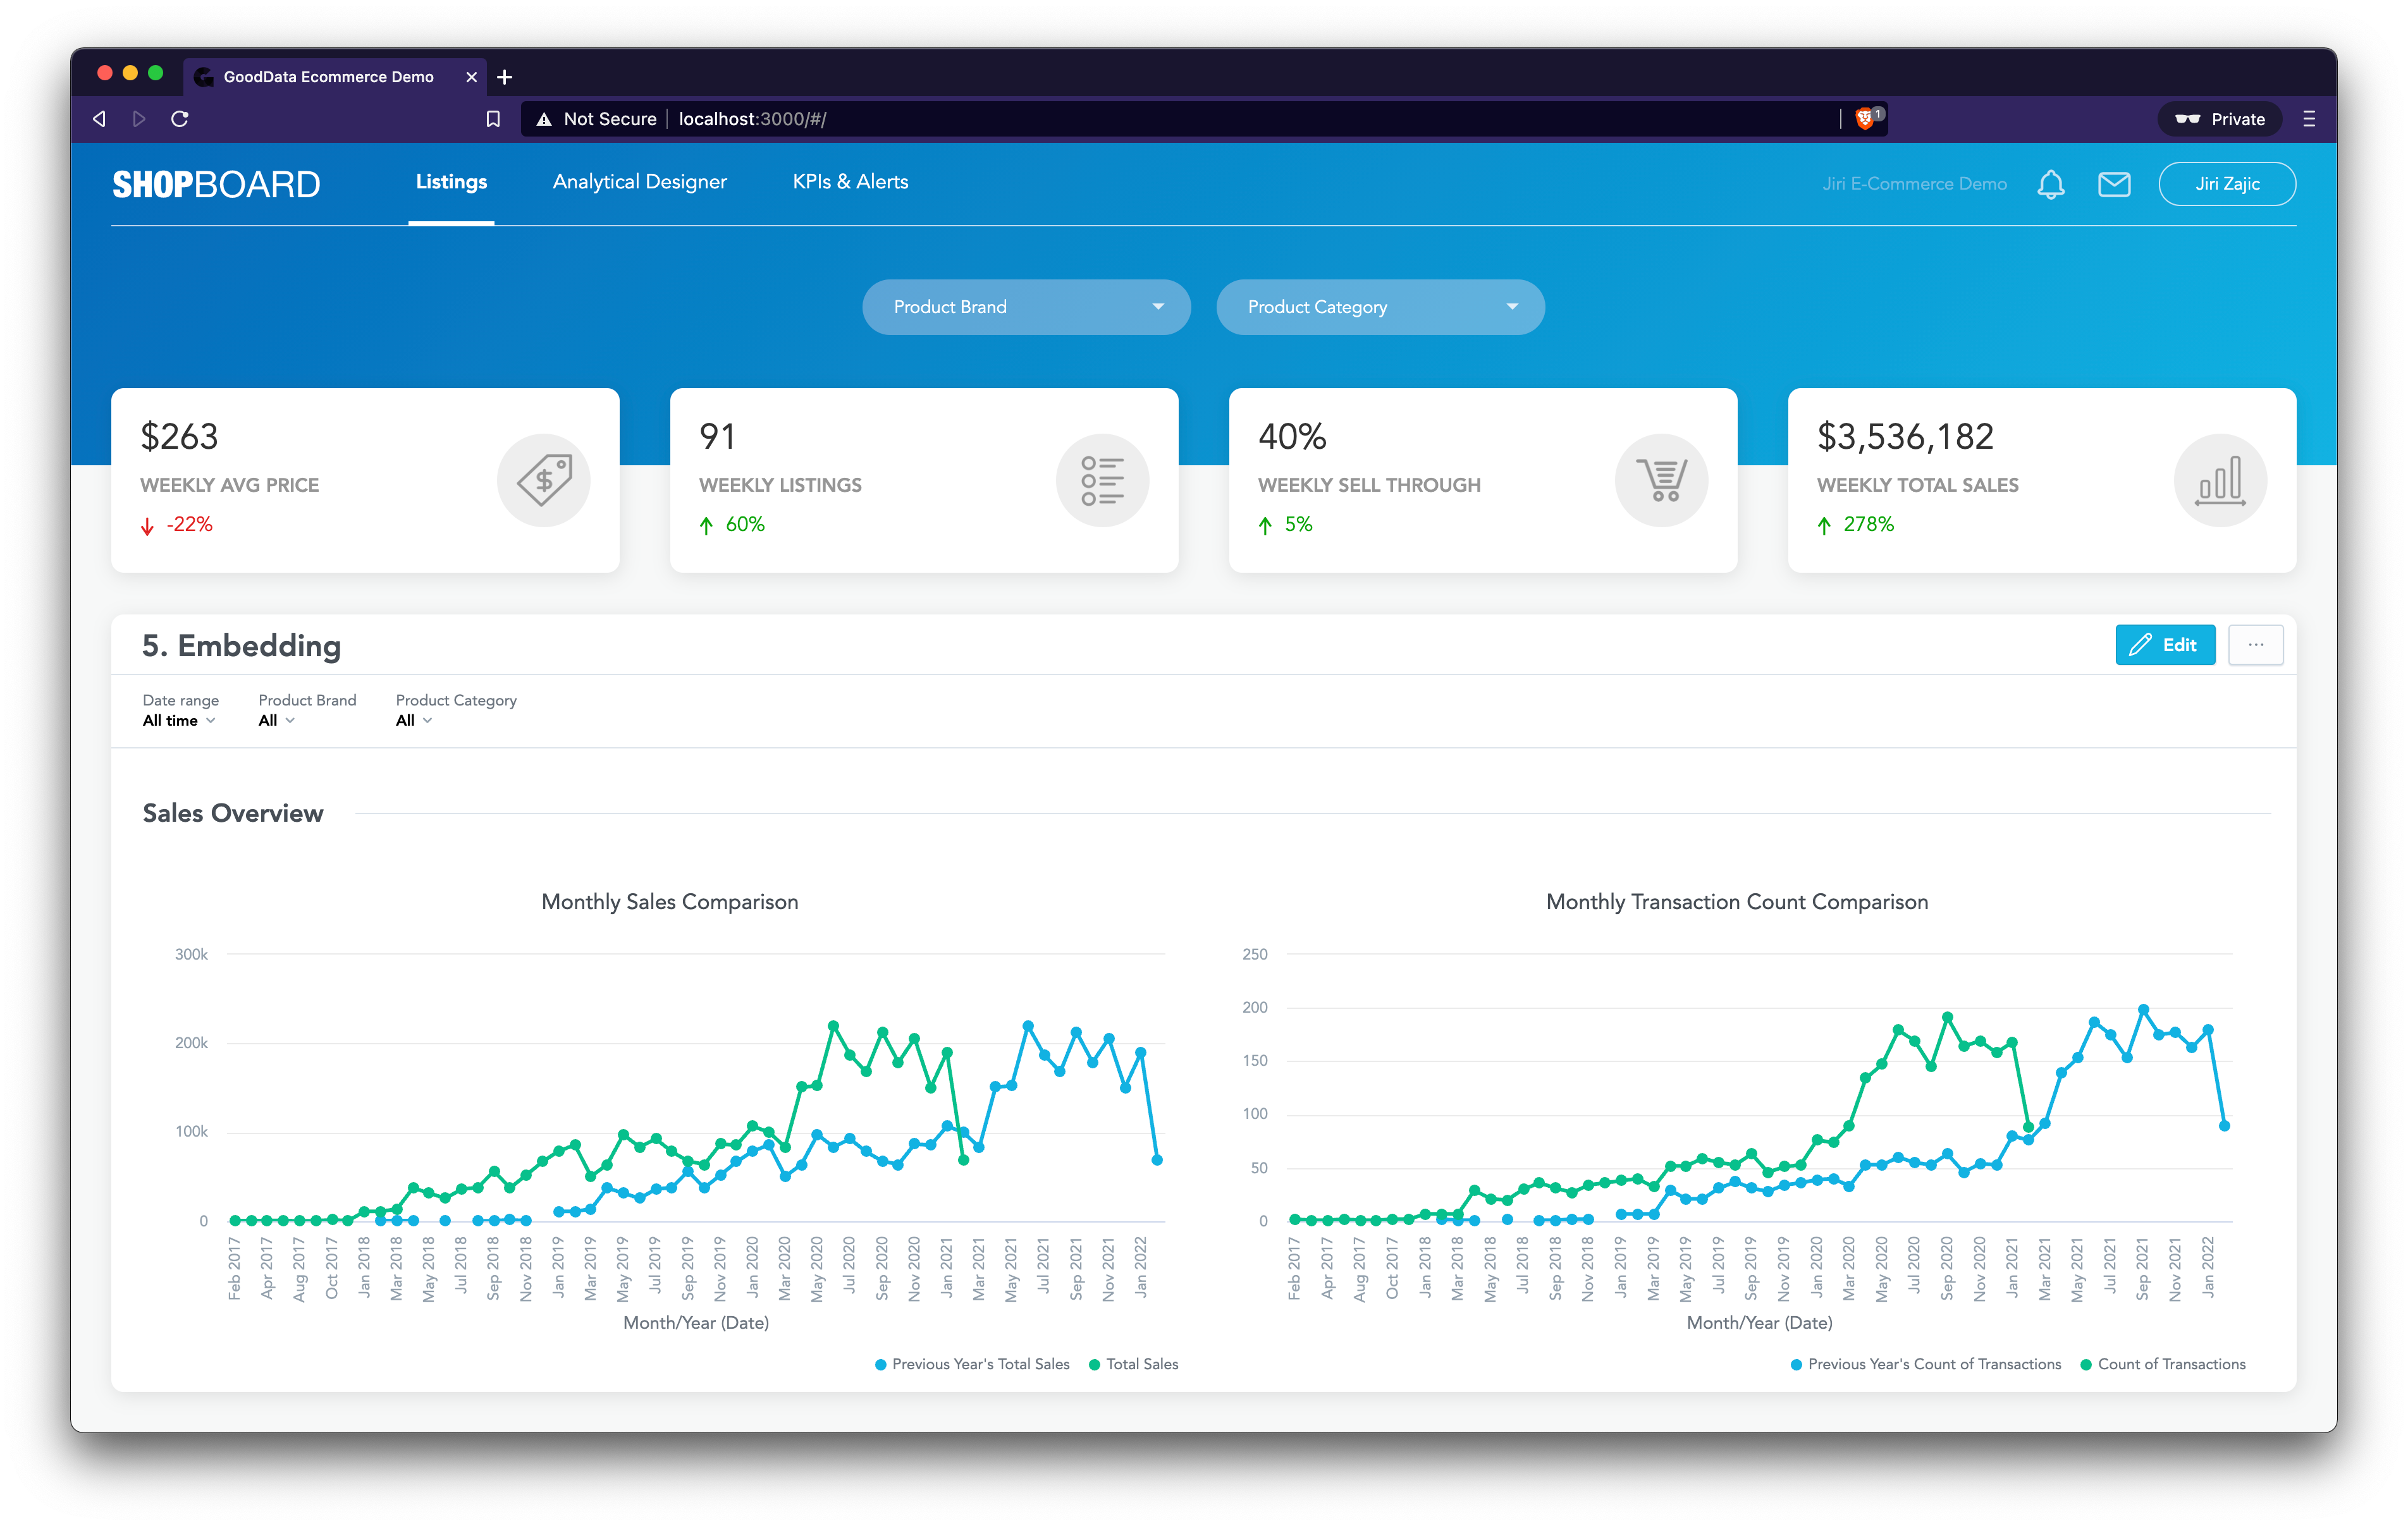
To replace the main hardcoded insights on the page with an iframe, we need to roughly do the following:
<MyPage>
  <AttributeDropdown attribute={PRODUCT_BRAND} />
  <AttributeDropdown attribute={PRODUCT_CATEGORY} />
  <Kpi measure={AVG_PRICE_OF_PRODUCTS} />
  <Kpi measure={TOTAL_LISTINGS} />
  <Kpi measure={PERC_SELL_THROUGH} />
  <Kpi measure={TOTAL_SALES} />
  <iframe src="https://secure.gooddata.com/dashboards/embedded/#/project/<projectId>/dashboard/<dashboardId>" />
</MyPage>
After a few necessary CSS adjustments, our application could look like this:
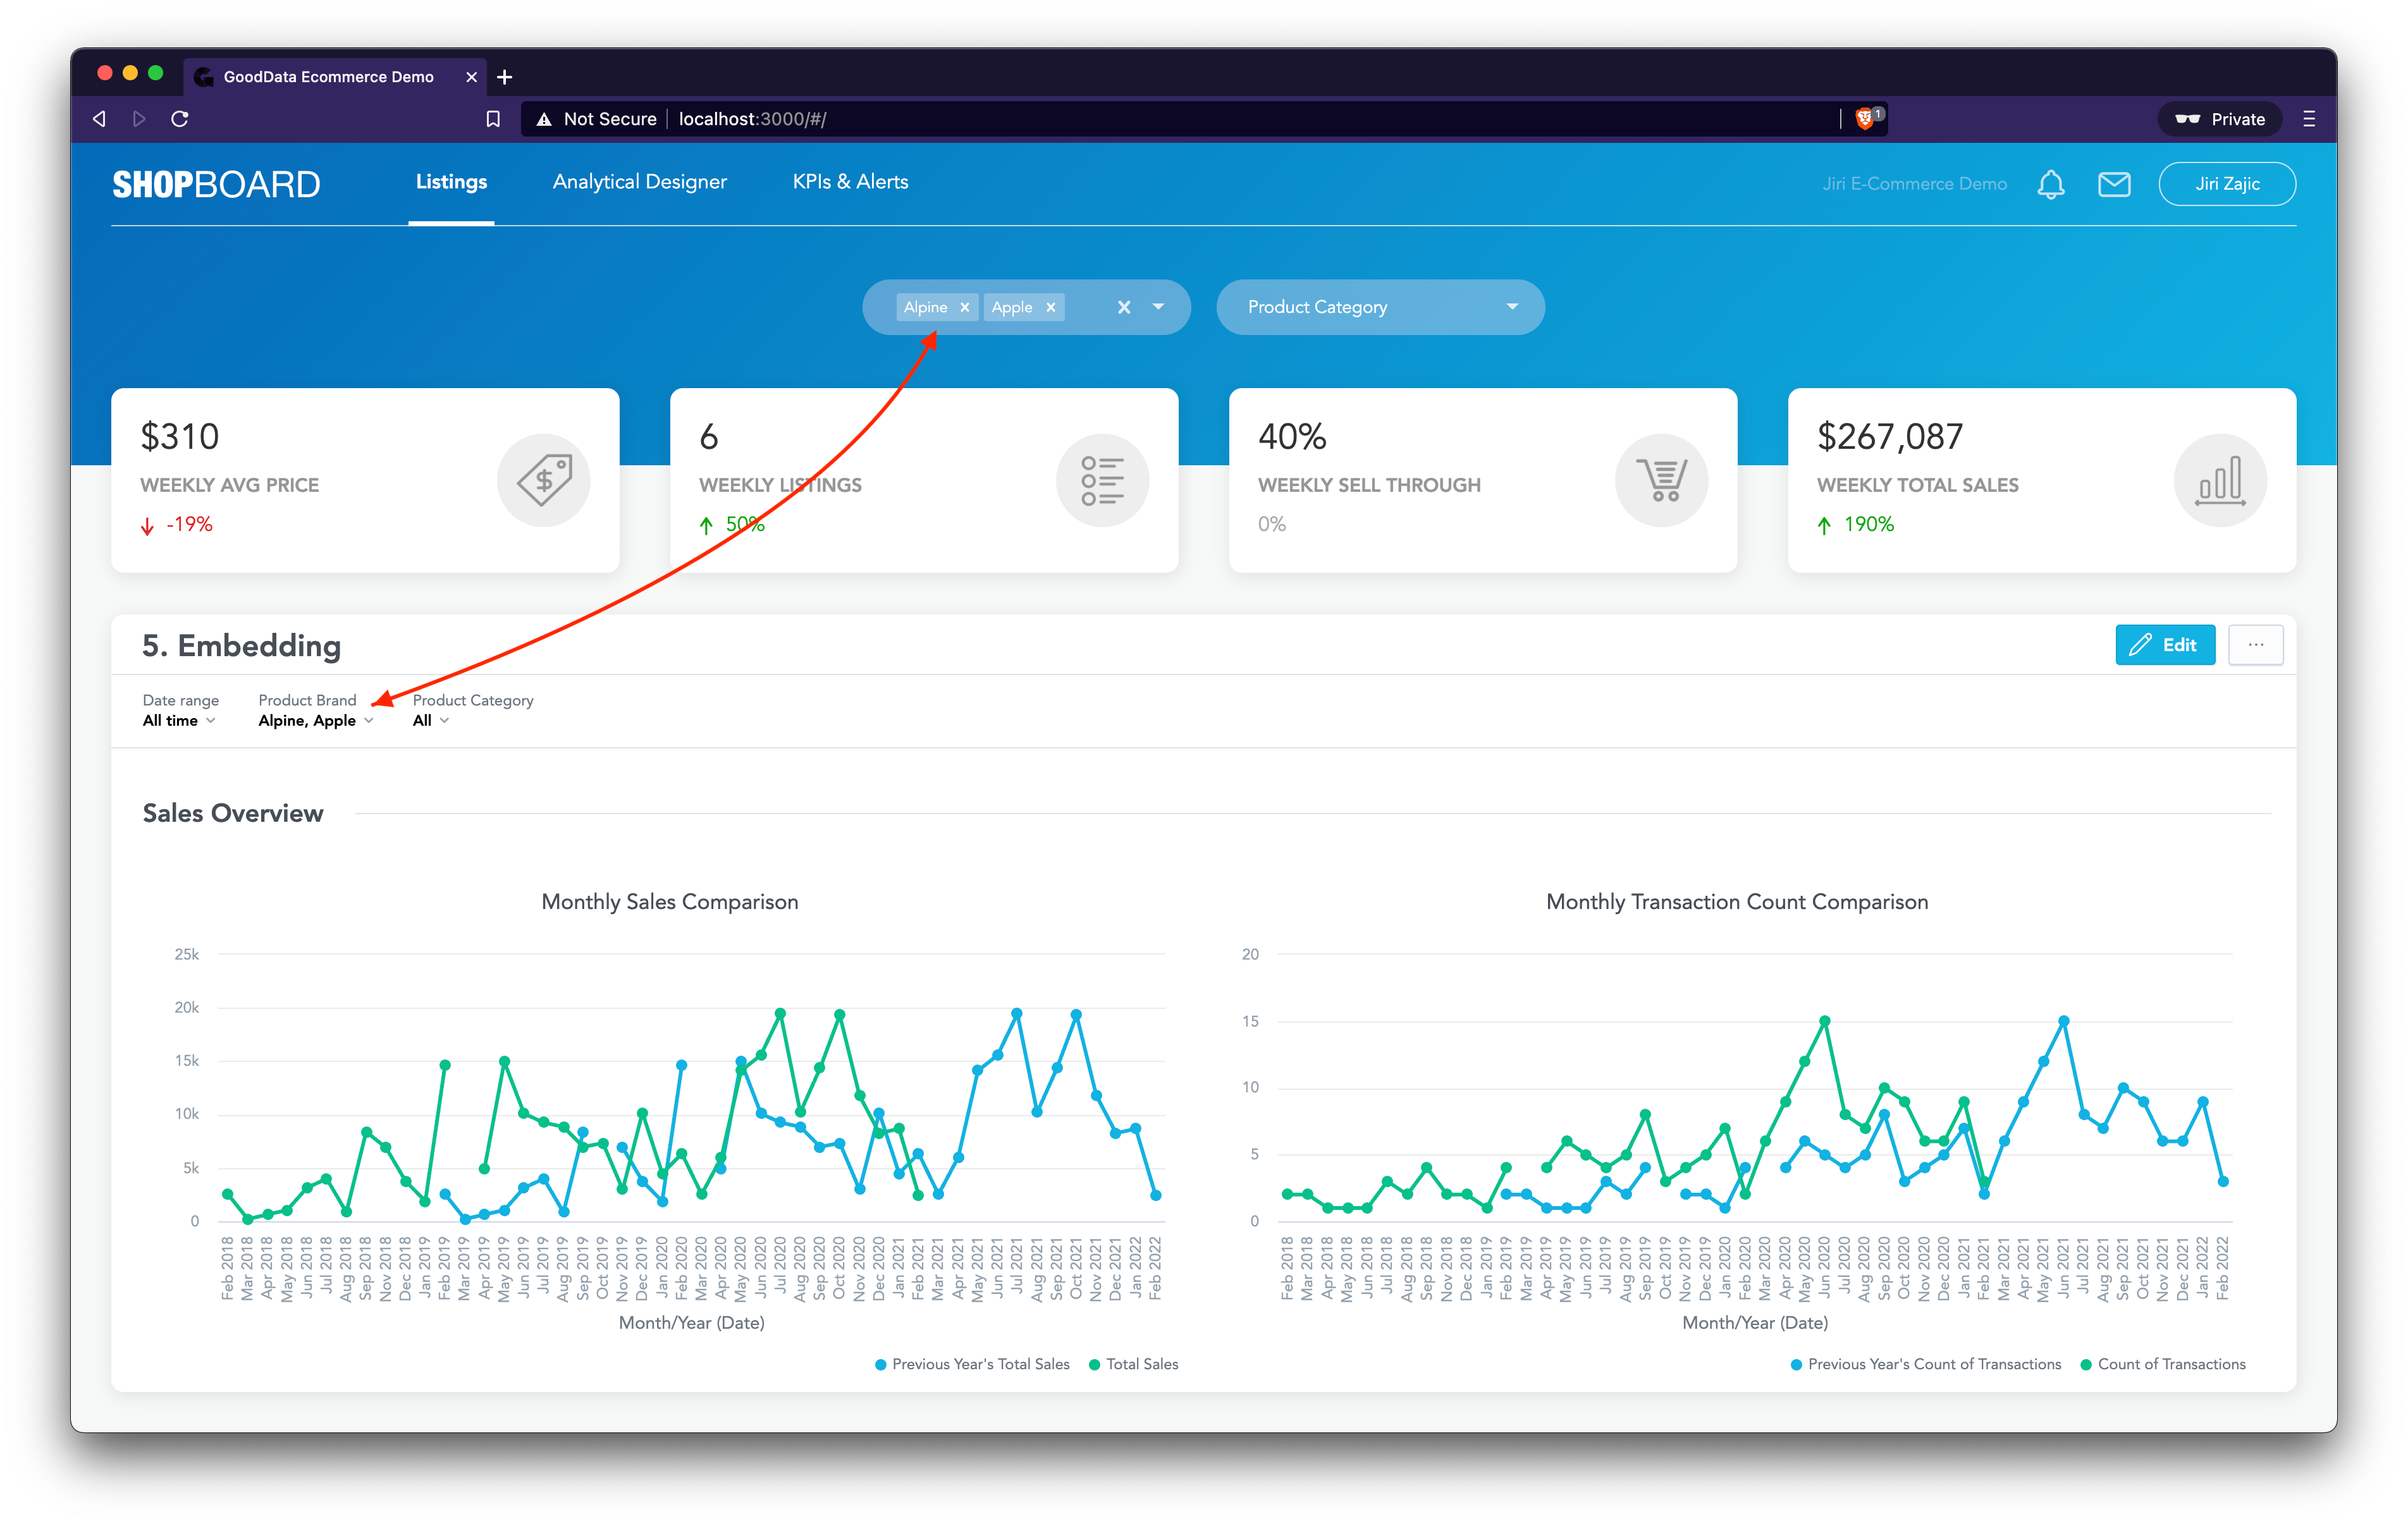
Now, we need to connect the custom filters at the top of the page to the dashboard in the iframe. For this, we’ll utilize so-called “commands” (GoodData Documentation on Commands). Commands are incoming messages sent from our application to the embedded Dashboard to apply actions. We’ll add the following logic into our attribute dropdown’s onChange handler:
document.getElementById(IFRAME_ID).contentWindow.postMessage(
  {
    gdc: {
      product: "dashboard",
      event: {
        name: "setFilterContext",
        data: {
          filters: [newFilter]
        }
      }
    }
  },
  backend
);
Every time Product Brand and Product Category filters are used, they will get propagated and applied to the embedded dashboard as well.
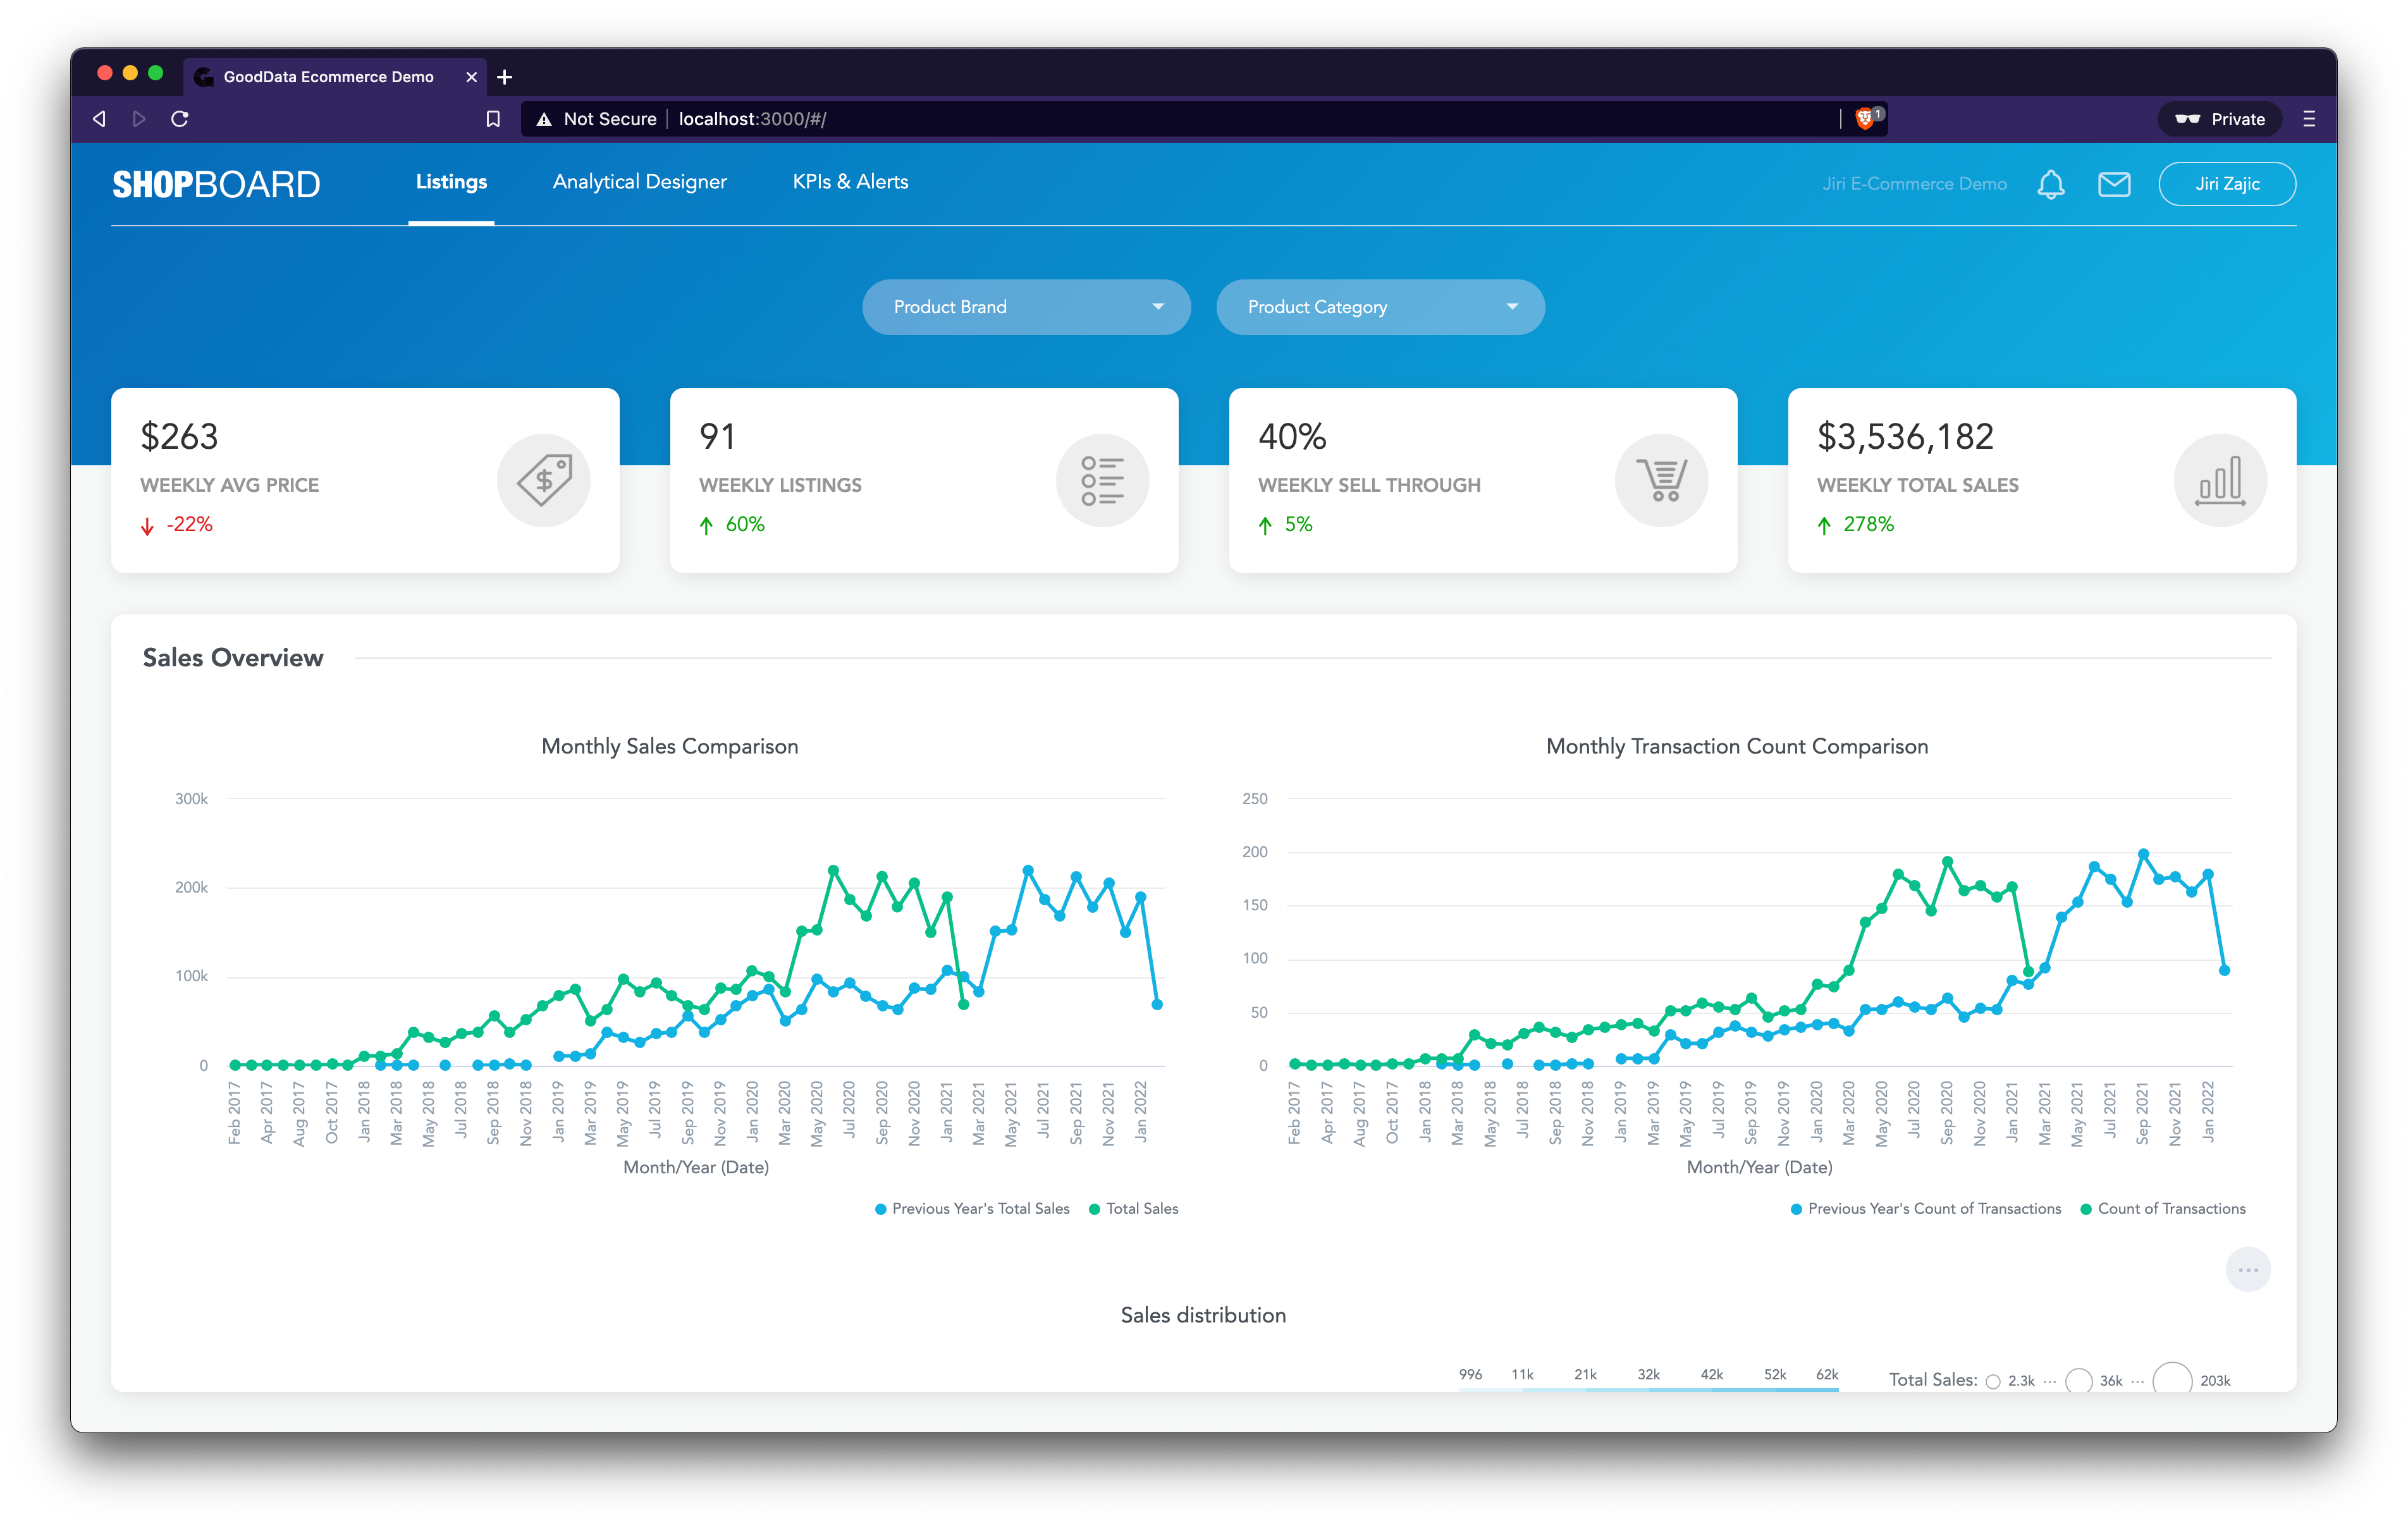
When we confirm that the shared filter context works as expected, as a last step we’re gonna hide the filter bar and the top bar by modifying the URL like so:
<iframe src=”https://secure.gooddata.com/dashboards/embedded/#/project/<projectId>/dashboard/<dashboardId>?showNavigation=false&hideControl=[filterBar,topBar]” />
Perfect!
Conclusion
Embedding Dashboards is fast and easy! Check our documentation to learn more about the embedding capabilities: GoodData Embedding Dashboards Documentation.
You can also use a React component to embed dashboards if you prefer not to use iframes.