Running Total Function in GoodData Platform (Sum vs Runsum)
Legacy Product Notice
This article is about our old product, GoodData Platform, that was current as of 1 September 2021. Features or behavior in newer versions may differ.
Running Total Functions allow you to keep track of a metric from the beginning of a period until now or calculate the statistics in between rows, such as total revenue year-to-date or the sum of revenue between the last 2 periods and now. In the GoodData Platform, you may use this function to calculate sum, average, minimum, maximum, variance, and standard deviation with the following syntax:
| Running Total Function | Syntax |
|---|---|
| Sum | runsum() |
| Average | runavg() |
| Minimum | runmin() |
| Maximum | runmax() |
| Variance | runvar() |
| Standard Deviation | runstdev() |
| Variance (Uncorrected) | runvarp() |
| Standard Deviation (Uncorrected) | runstdevp() |
Table 1: List of Running Total Functions available in GoodData Platform
The Running Total Functions are a great tool for calculating moving averages or accumulated summation. In this article, we will explore how to use the running total function to define metrics in the GoodData Platform with the logical data model (LDM) shown below:
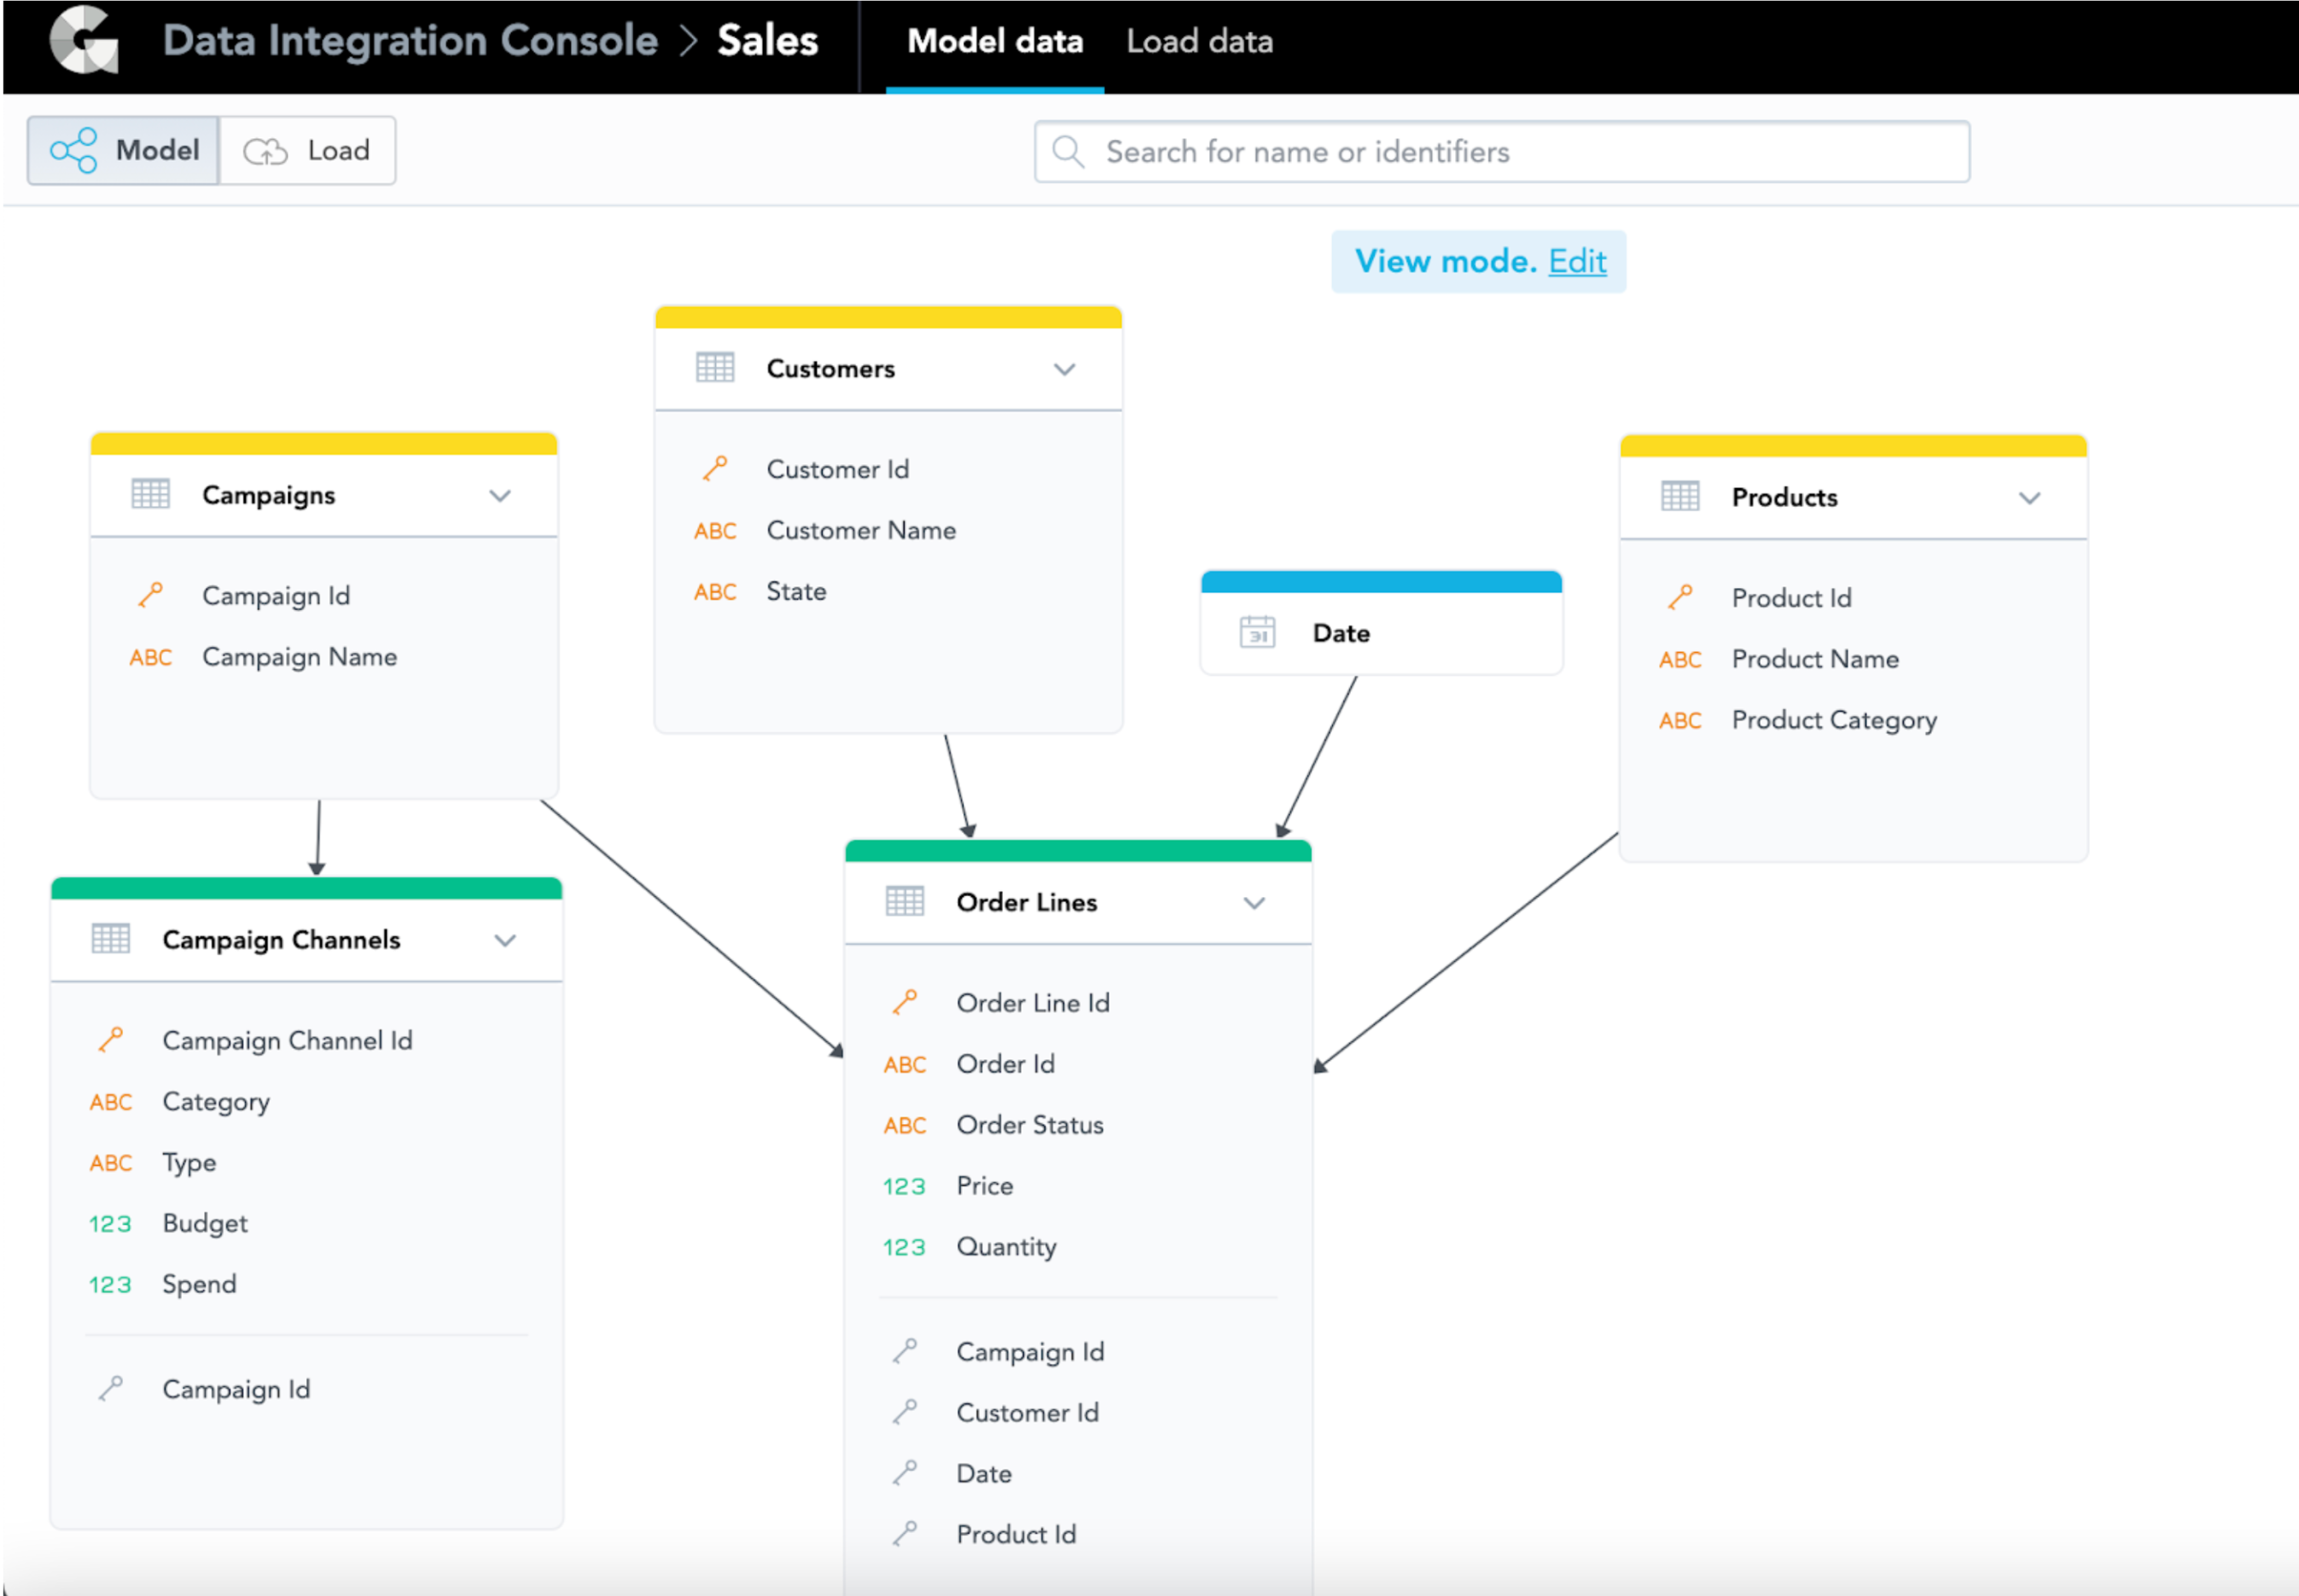
Diagram 1: LDM of Sales
Sum vs. Runsum
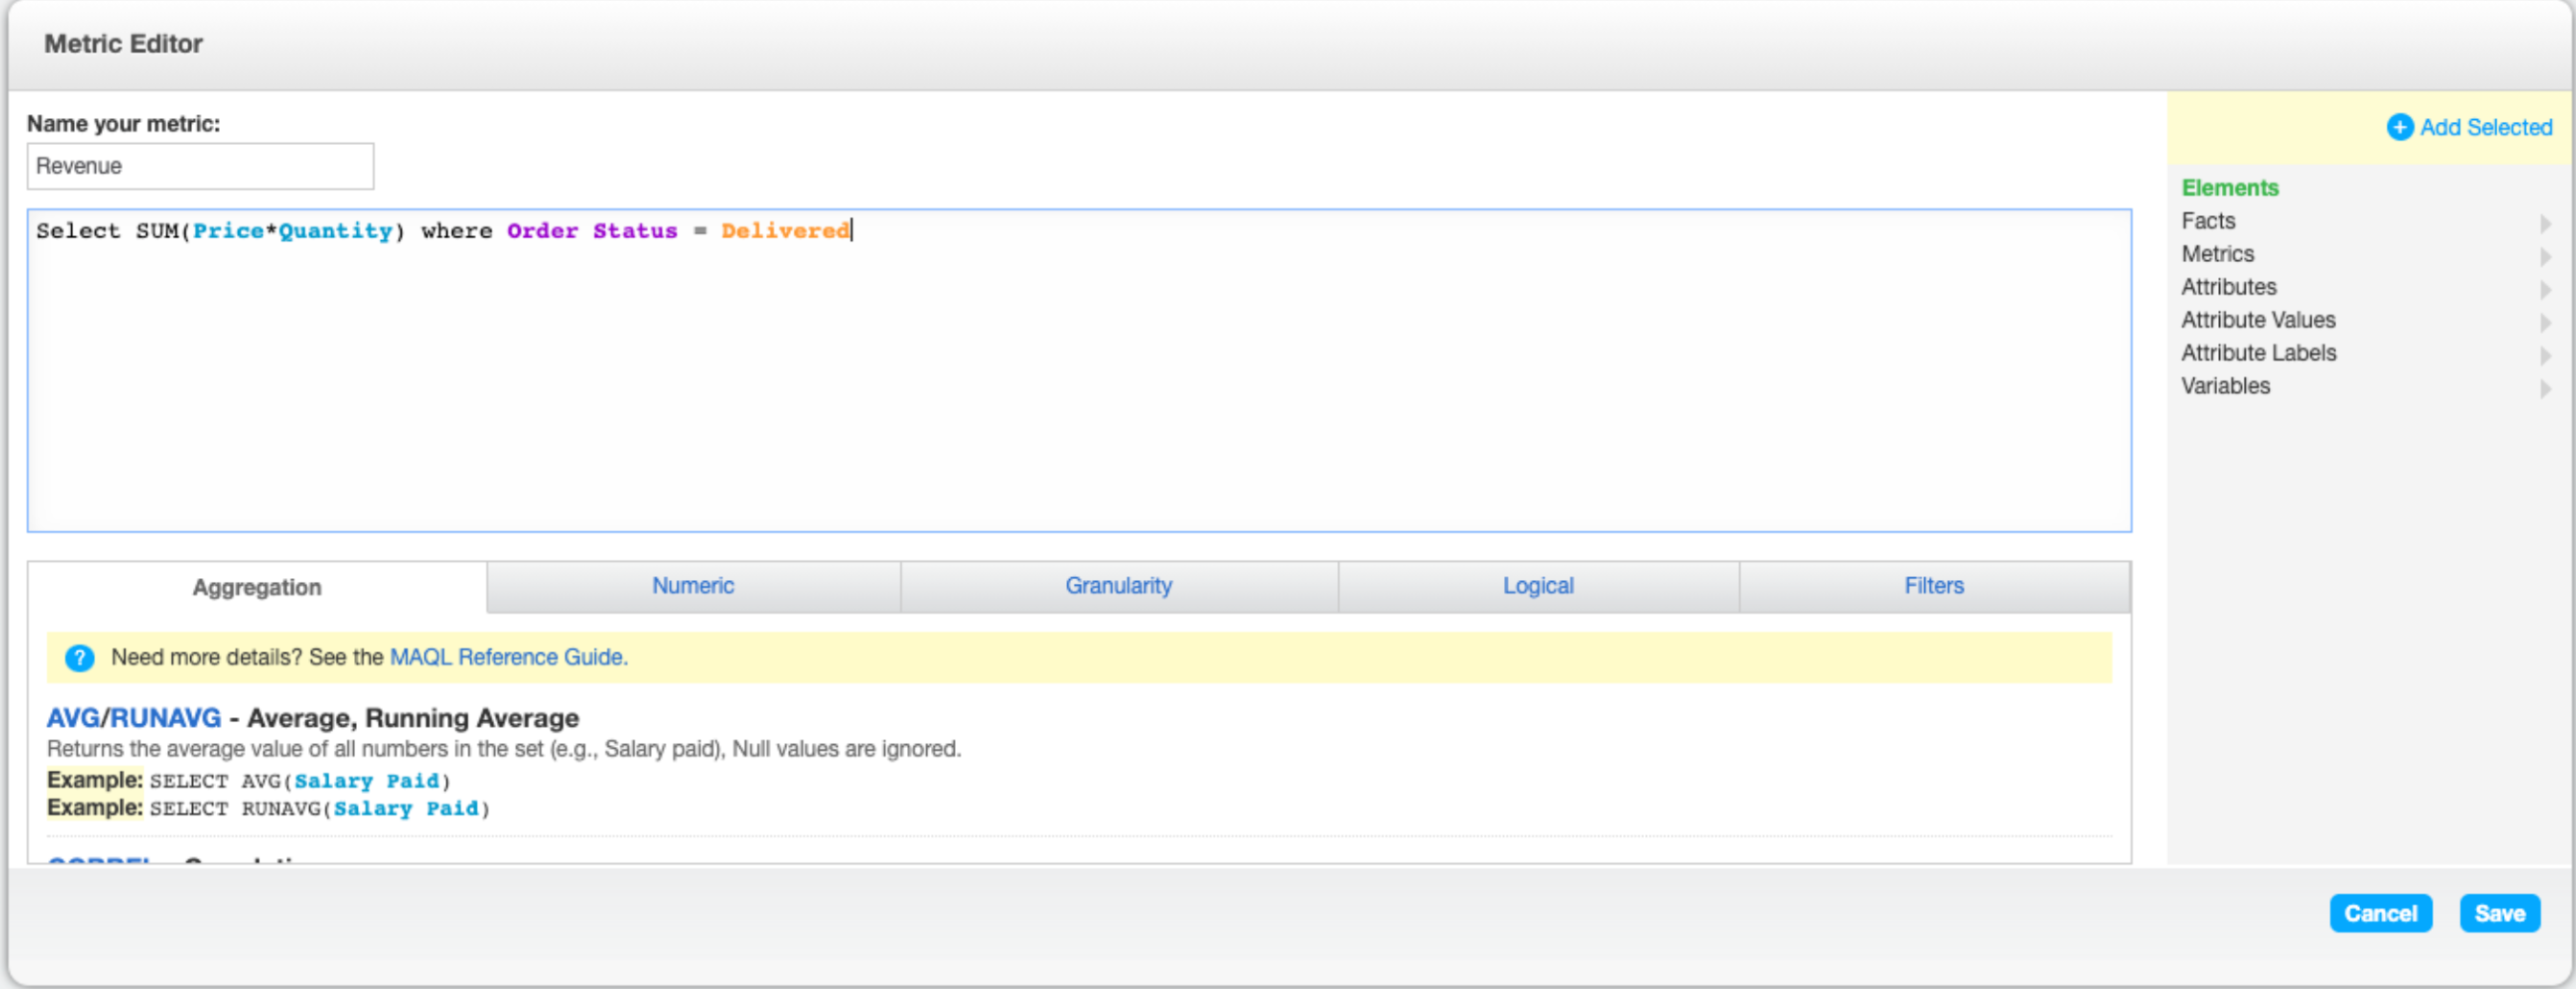
What makes runsum different from sum is that runsum accumulates the summation made in the previous period or dimension. To demonstrate the difference, let’s define 2 metrics using both syntaxes to calculate the revenue:
Syntax 1:
SELECT SUM(Price * Quantity) WHERE Order Status = 'Delivered'
Syntax 2:
SELECT RUNSUM(Price * Quantity) WHERE Order Status = 'Delivered'
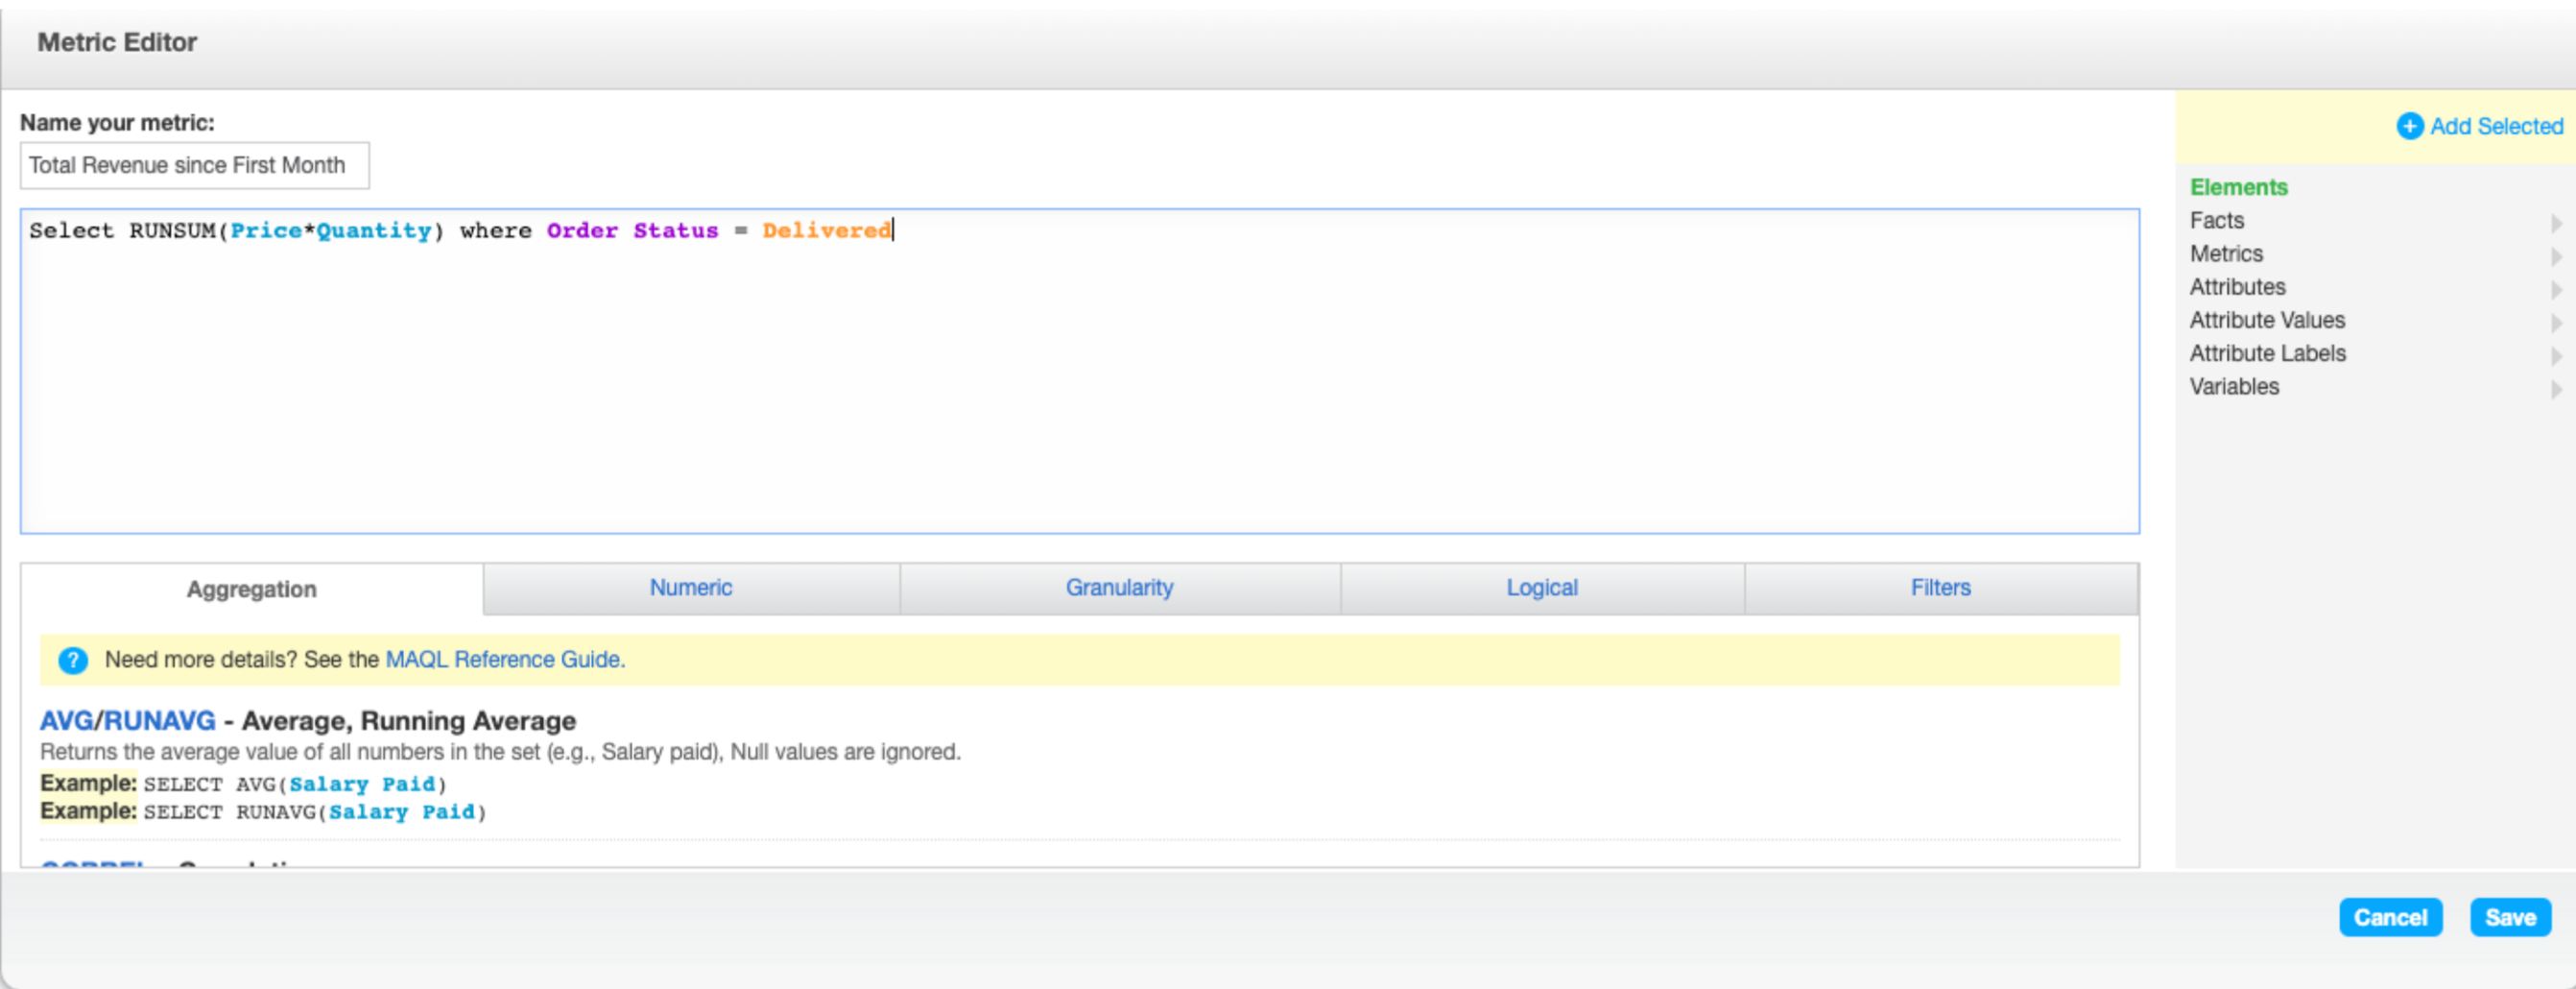
I have named the metrics Revenue and Total Revenue since First Month for Syntax 1 and Syntax 2, respectively. Let’s put these metrics in a table in Analytical Designer segmented by Date and observe the difference between Syntax 1 and Syntax 2:
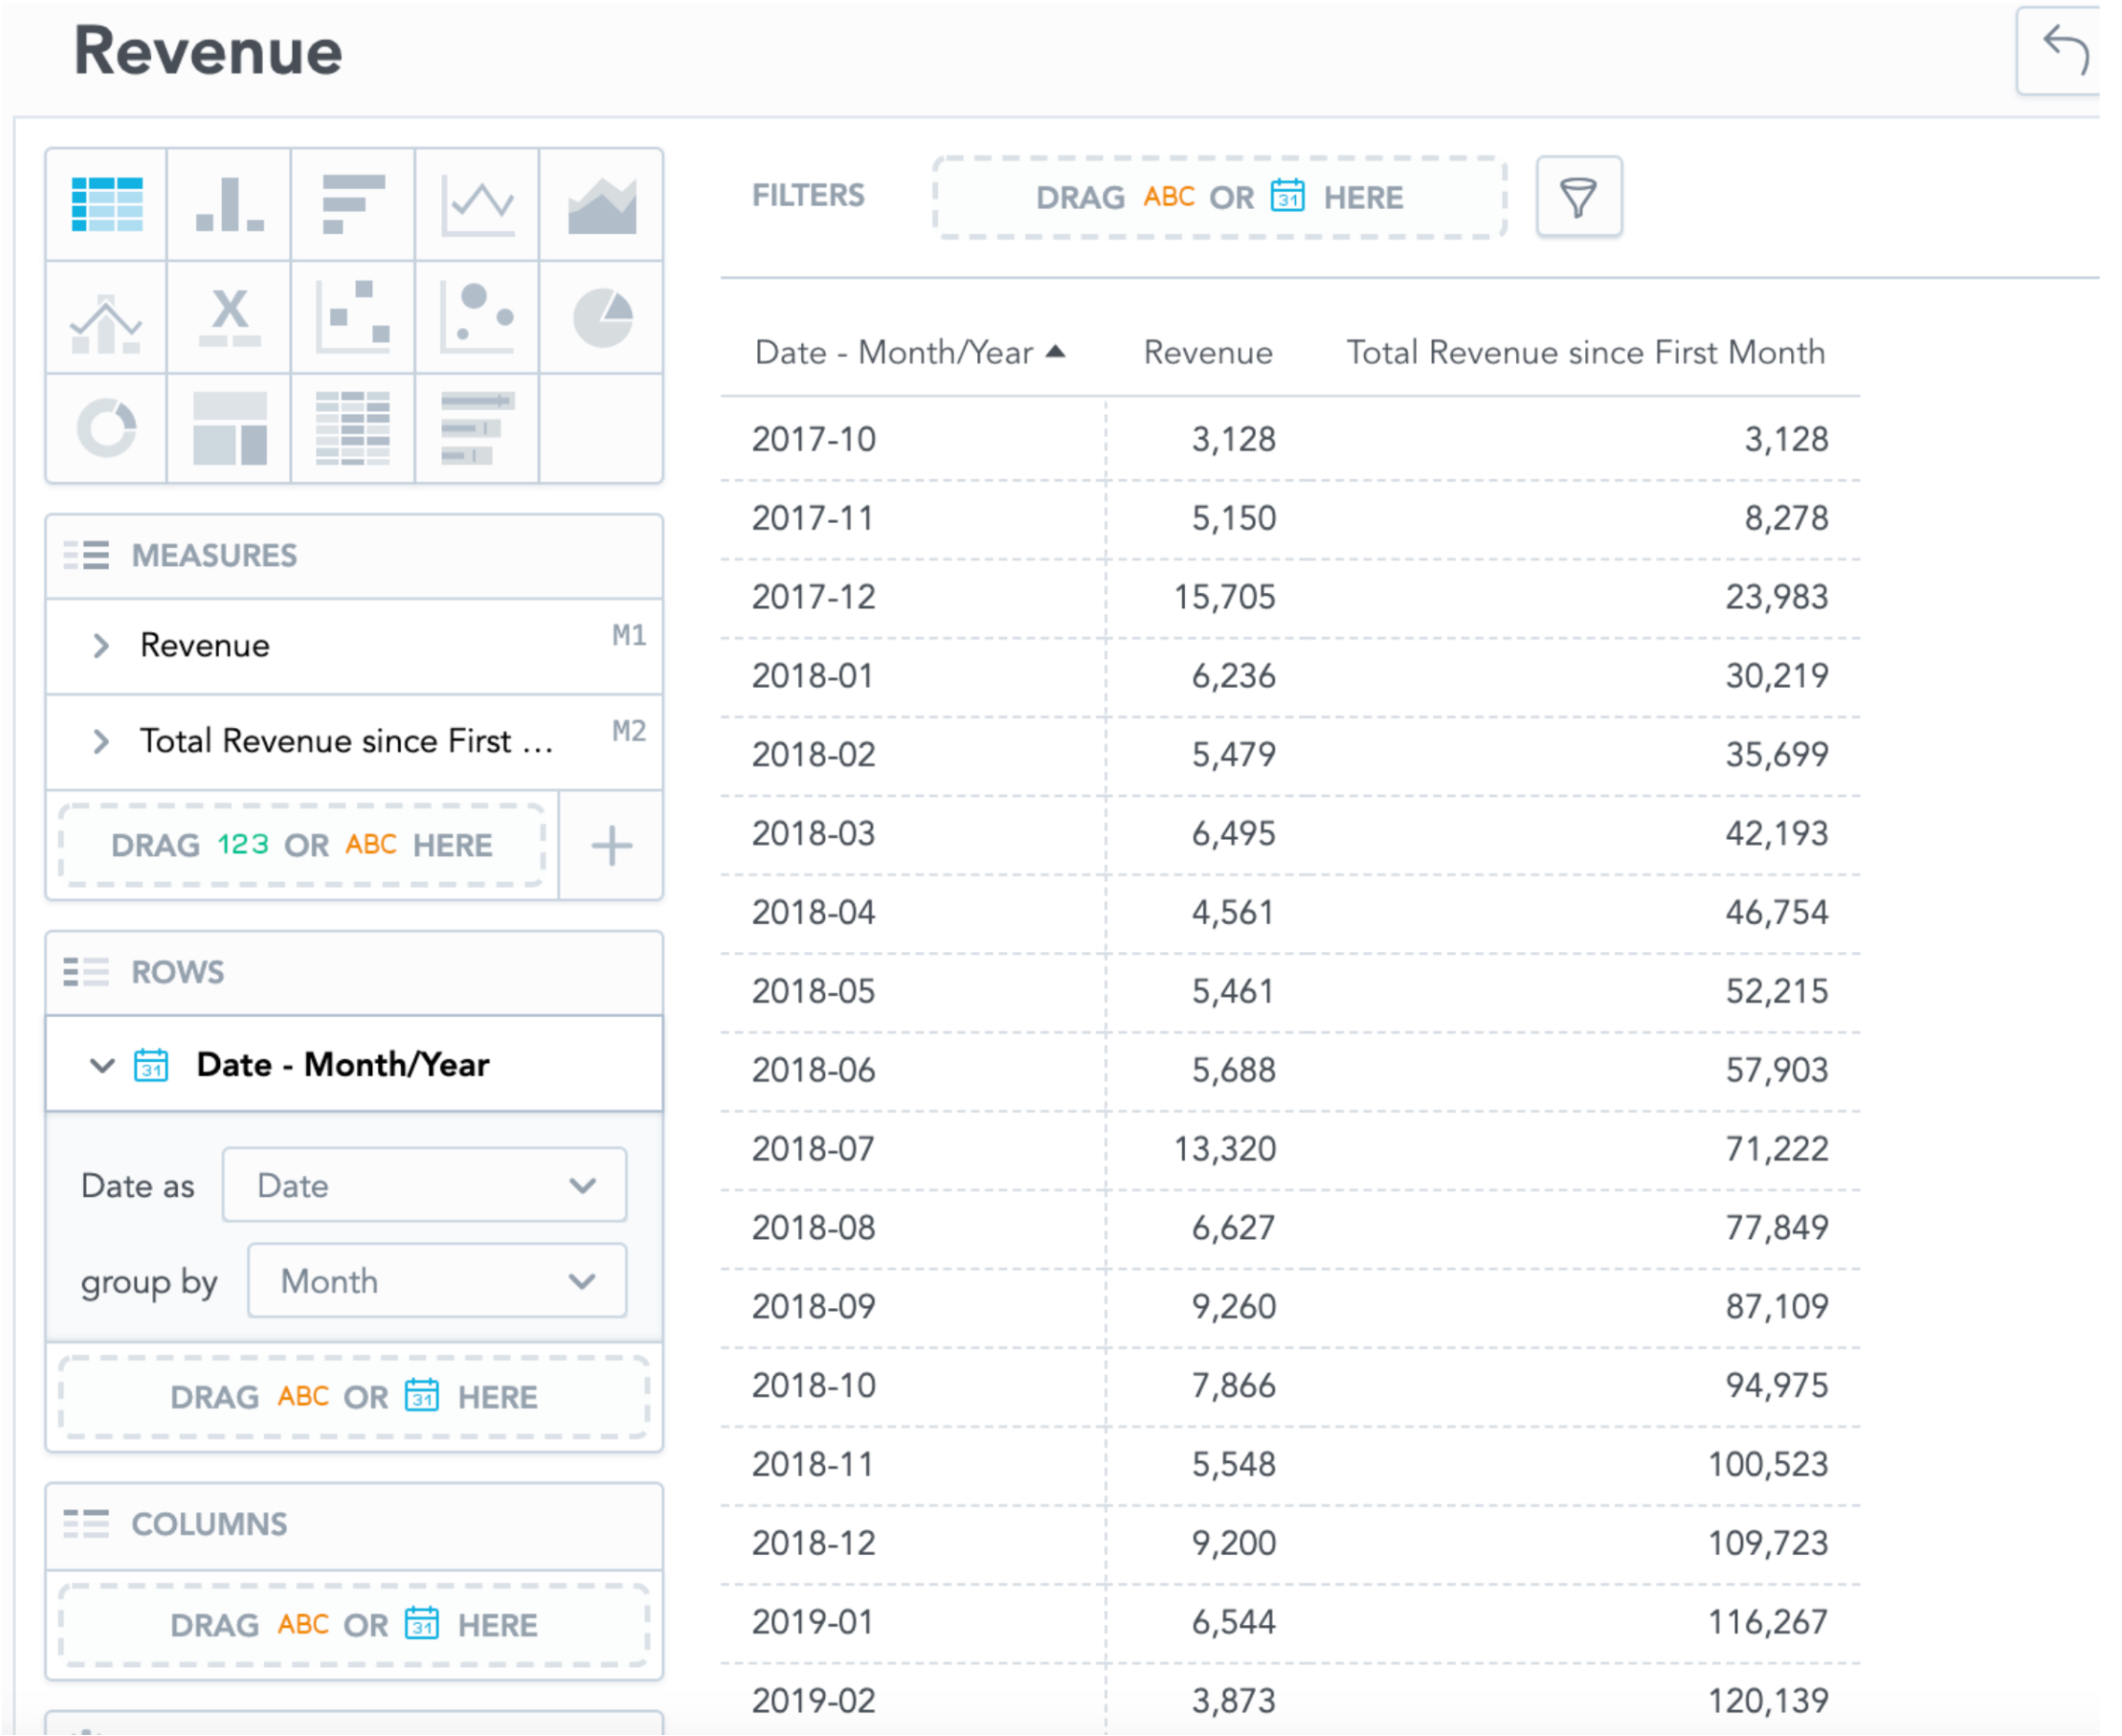
Once the data is segmented, we can see the Total Revenue since First Month accumulates the previous month’s revenue. In contrast, Revenue only displays the revenue of the respective month/year. We did not specify the timeframe for Syntax 2 to accumulate the revenue. Therefore, Total Revenue since First Month accumulates the revenue from the first available period, Oct 2017.
And, of course, it works the same with other statistical metrics. If you are interested in minimum or maximum revenue, replace runsum with runmin or runmax.
Running Total Within a Specific Timeframe
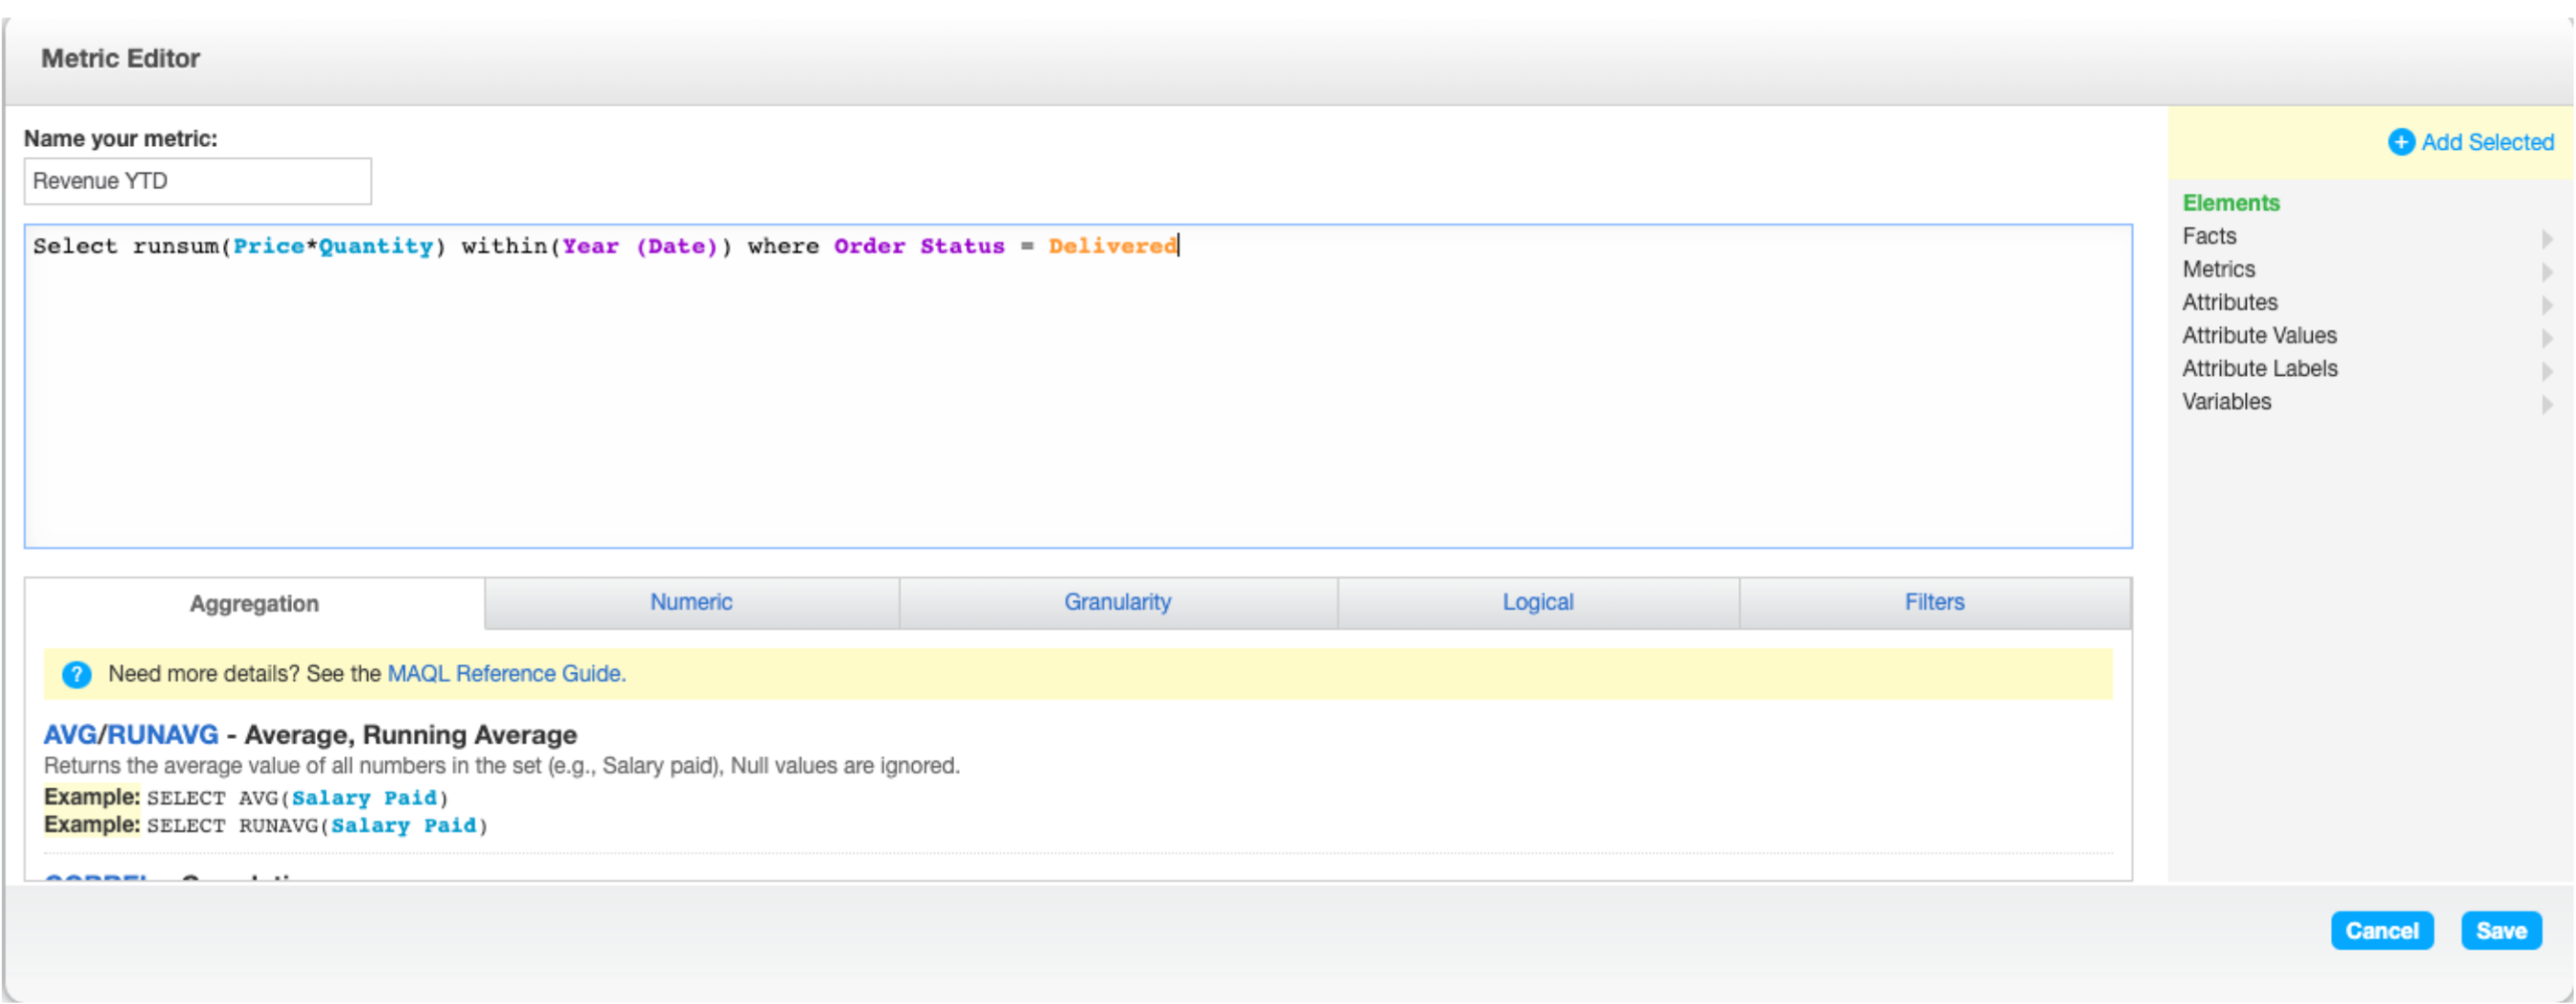
A limitation of Syntax 2 is that the metric includes all historical data; it may be more useful to calculate the given metric within a specific timeframe for reporting purposes. For example, users may be more interested in daily revenue and Year-to-date accumulated daily revenue (summation of revenue from the beginning of the year to the current date). It means we have to modify Syntax 2 only to sum the daily revenue within each year. To do this, we need to specify the timeframe using the keyword within() in the syntax. The keyword only accepts date attributes. Syntax 3 below is the modified syntax for year-to-date revenue:
Syntax 3:
SELECT RUNSUM(Price * Quantity) WITHIN (Year(Date)) WHERE Order Status = 'Delivered'
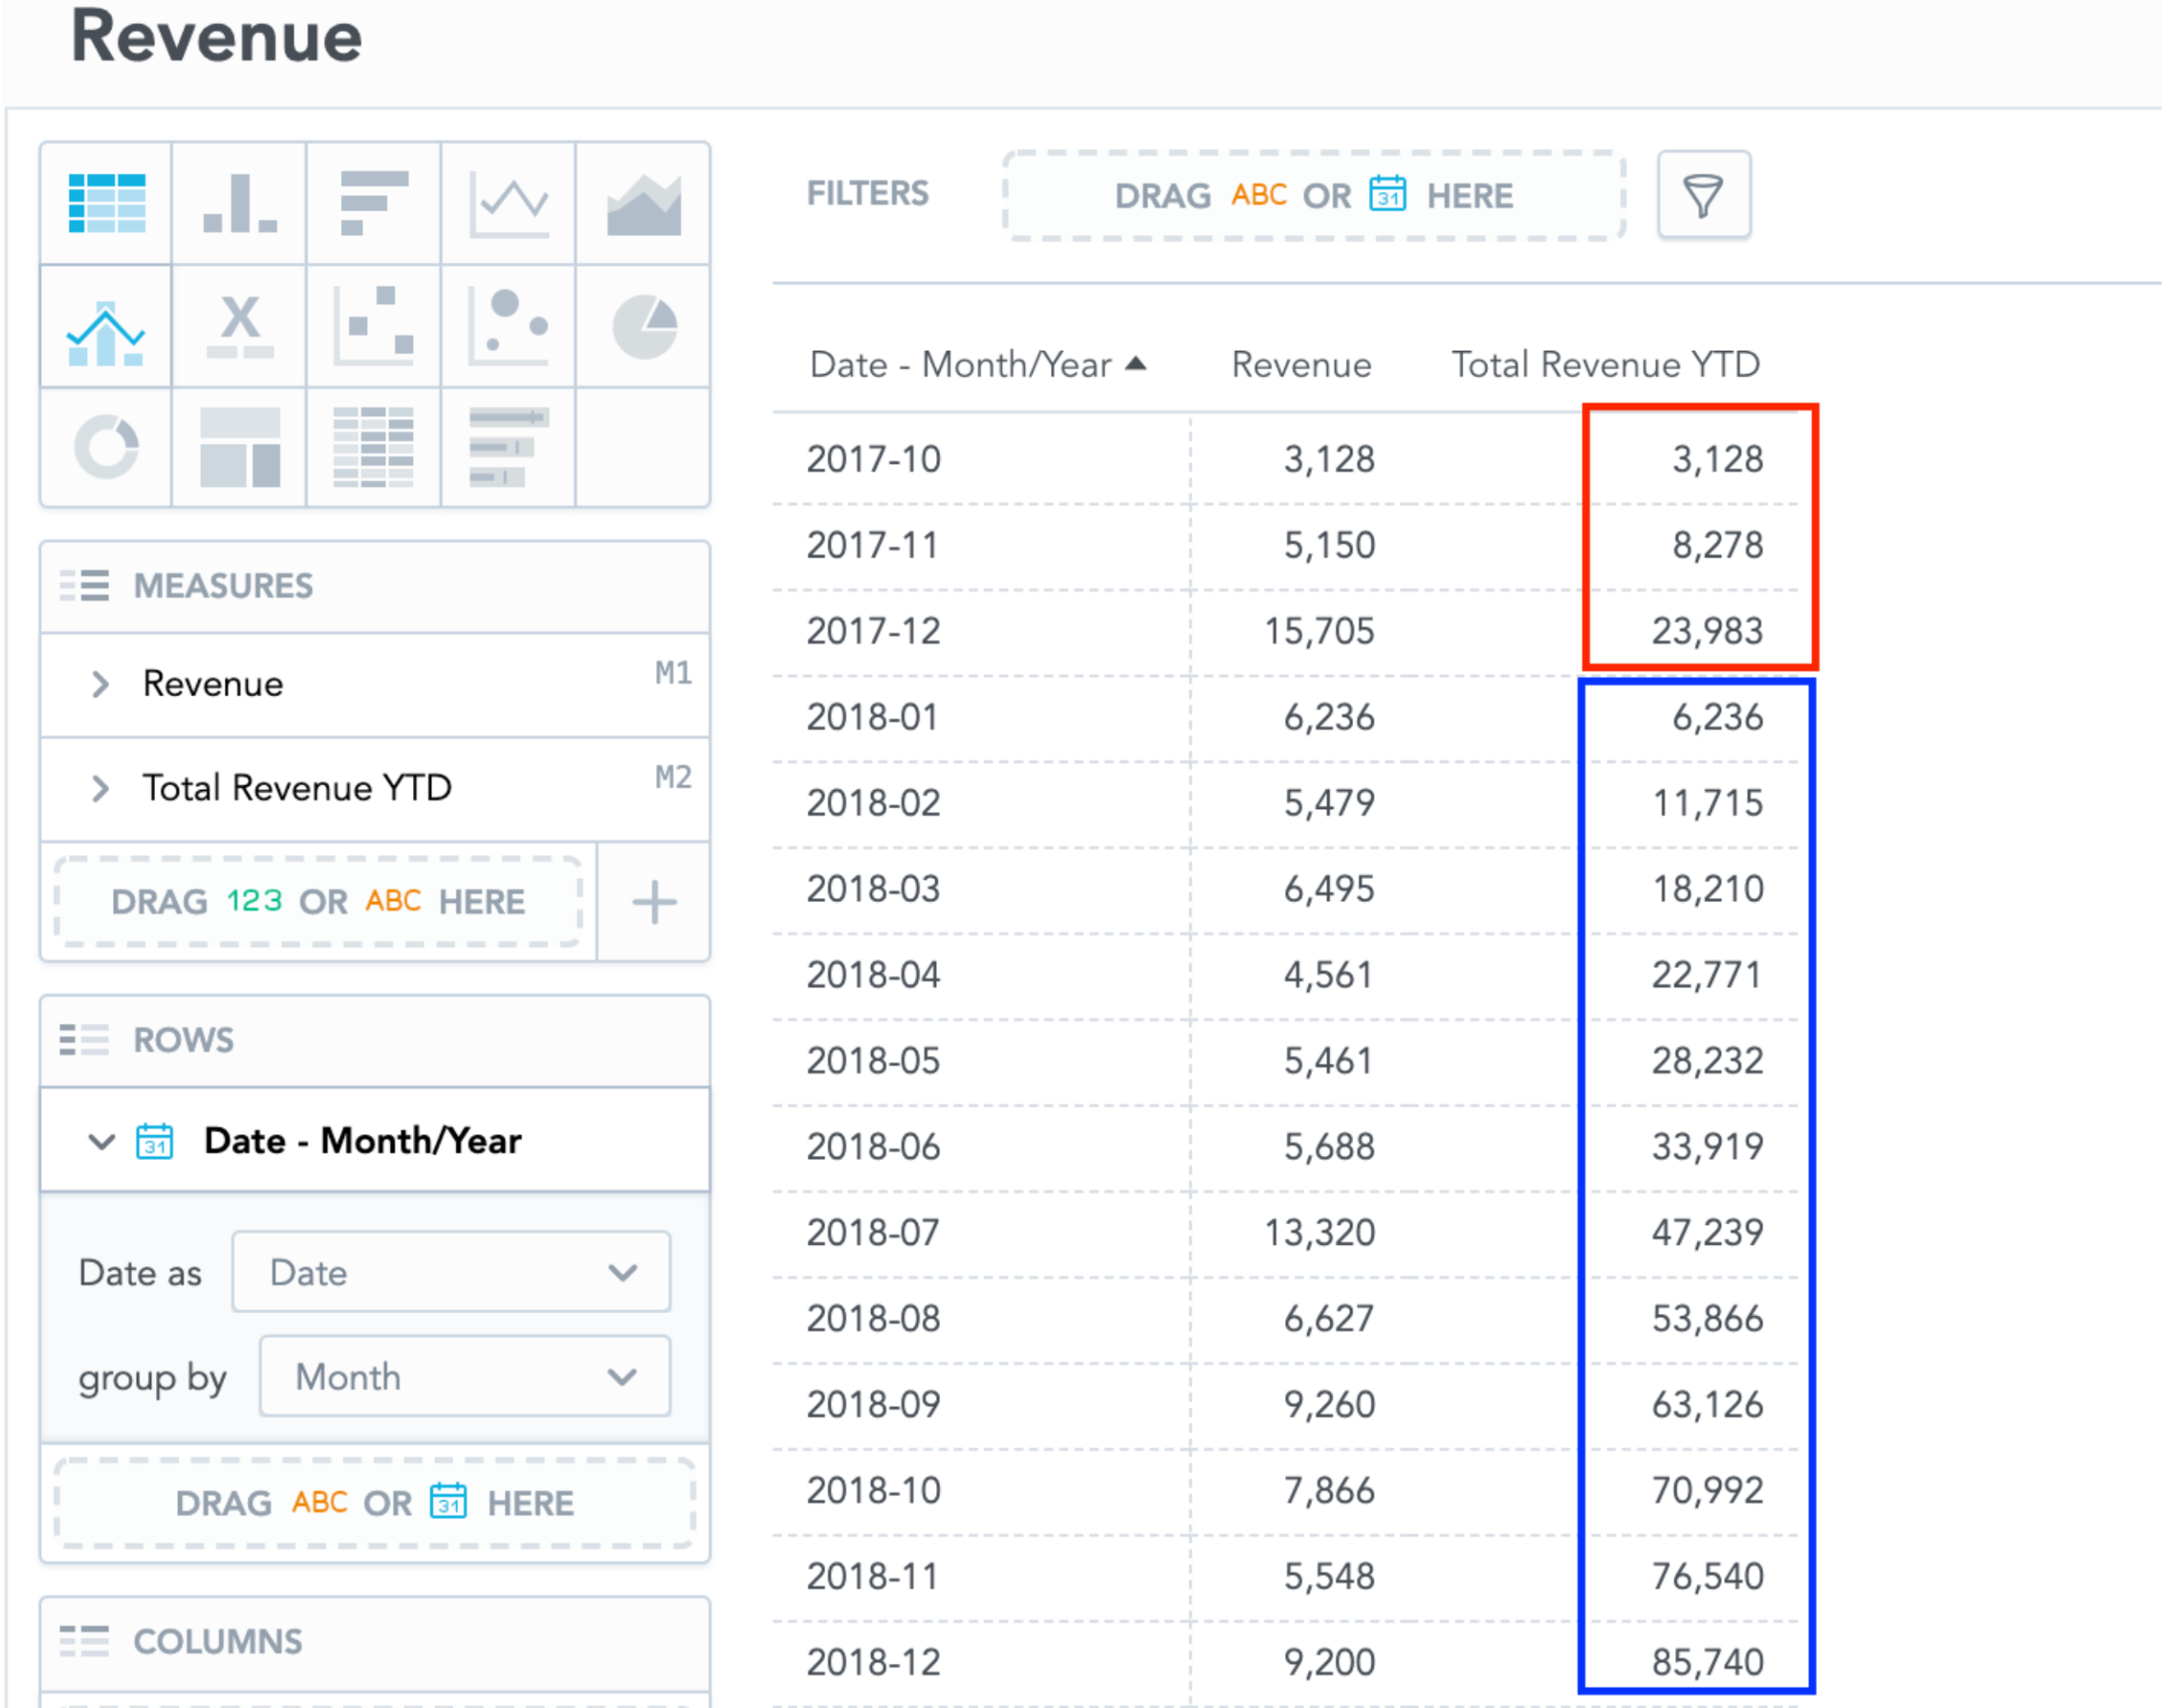
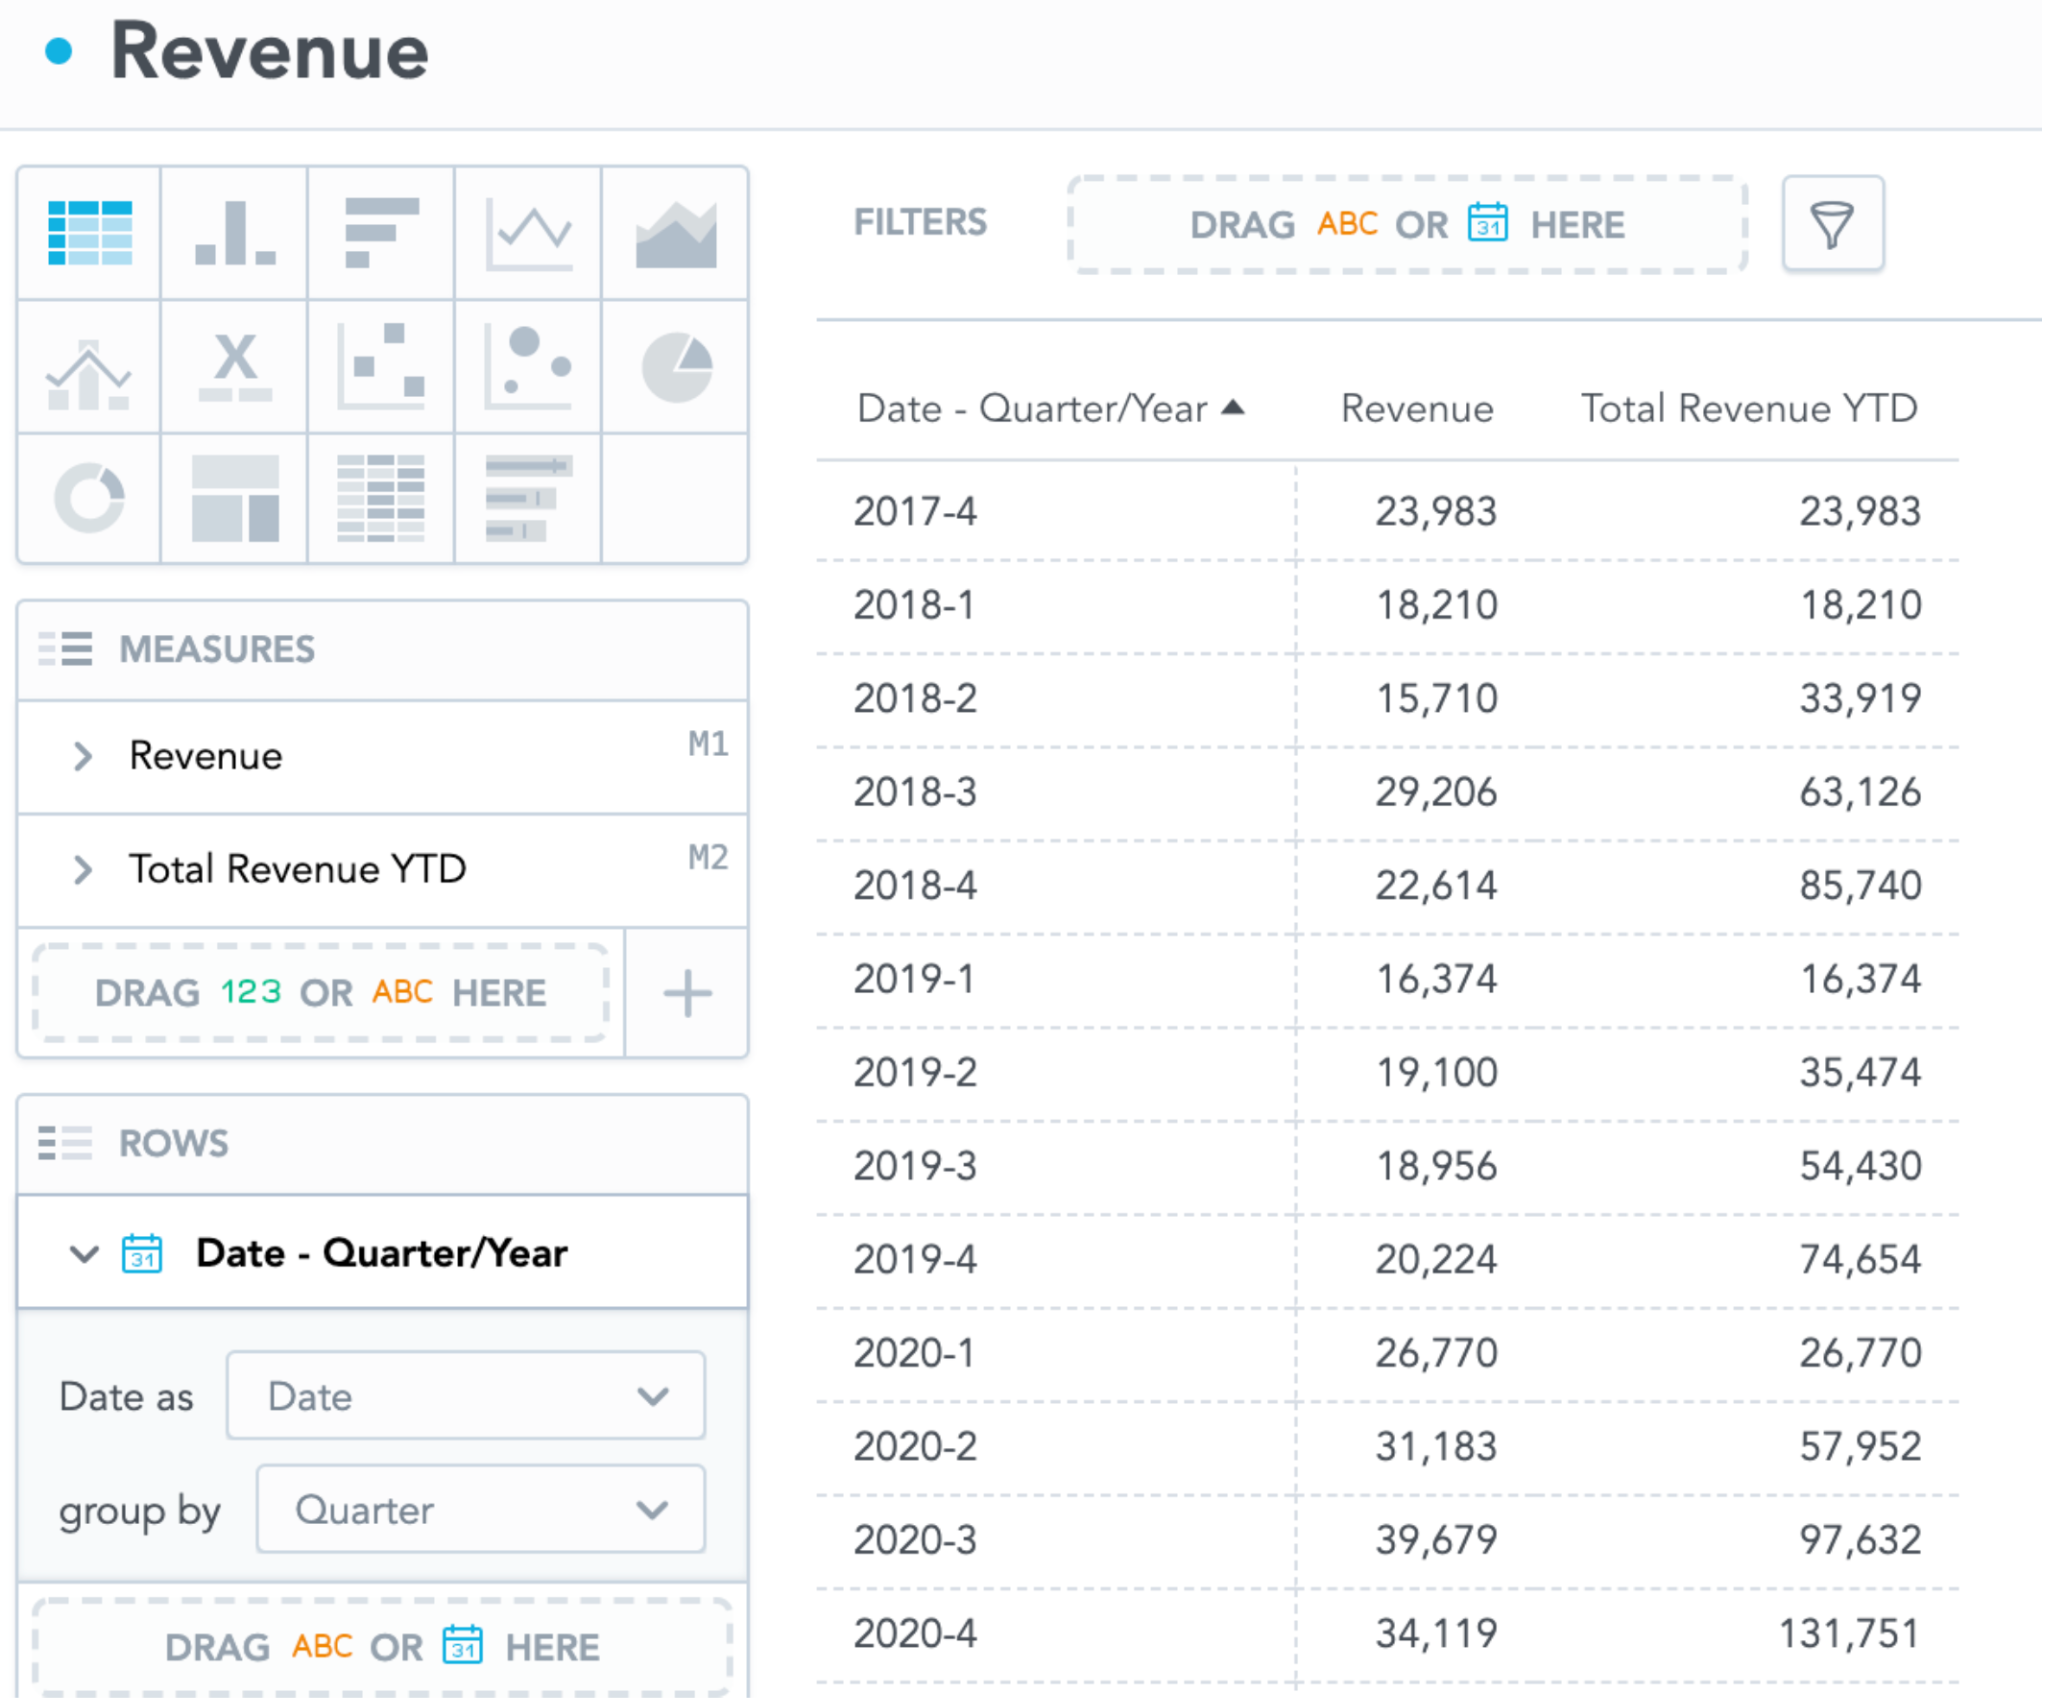
As we expected, the metrics only accumulate the revenue within each year, resetting the calculation in January 2018. Total Revenue YTD can be segmented in other date granularity lower than Year, like Quarter:
However, this functionality does not work when segmented by the same date granularity (like year in our example) or any non-chronological date granularity (like month of year or day of month).
Rolling Window
GoodData Cloud offers the ability to calculate statistics within a window frame, such as moving averages. The format of the rolling window is:
SELECT runsum(<attribute/fact/metric>) Rows between <Specific row(s)> and <Specific row(s)>
You may place N preceding, N following, current row to represent N previous rows, N following rows, and current row, respectively. For example, if I would like to have a 5-day moving average of revenue (taking an average of the last 4 days and today), I may have the following MAQL:
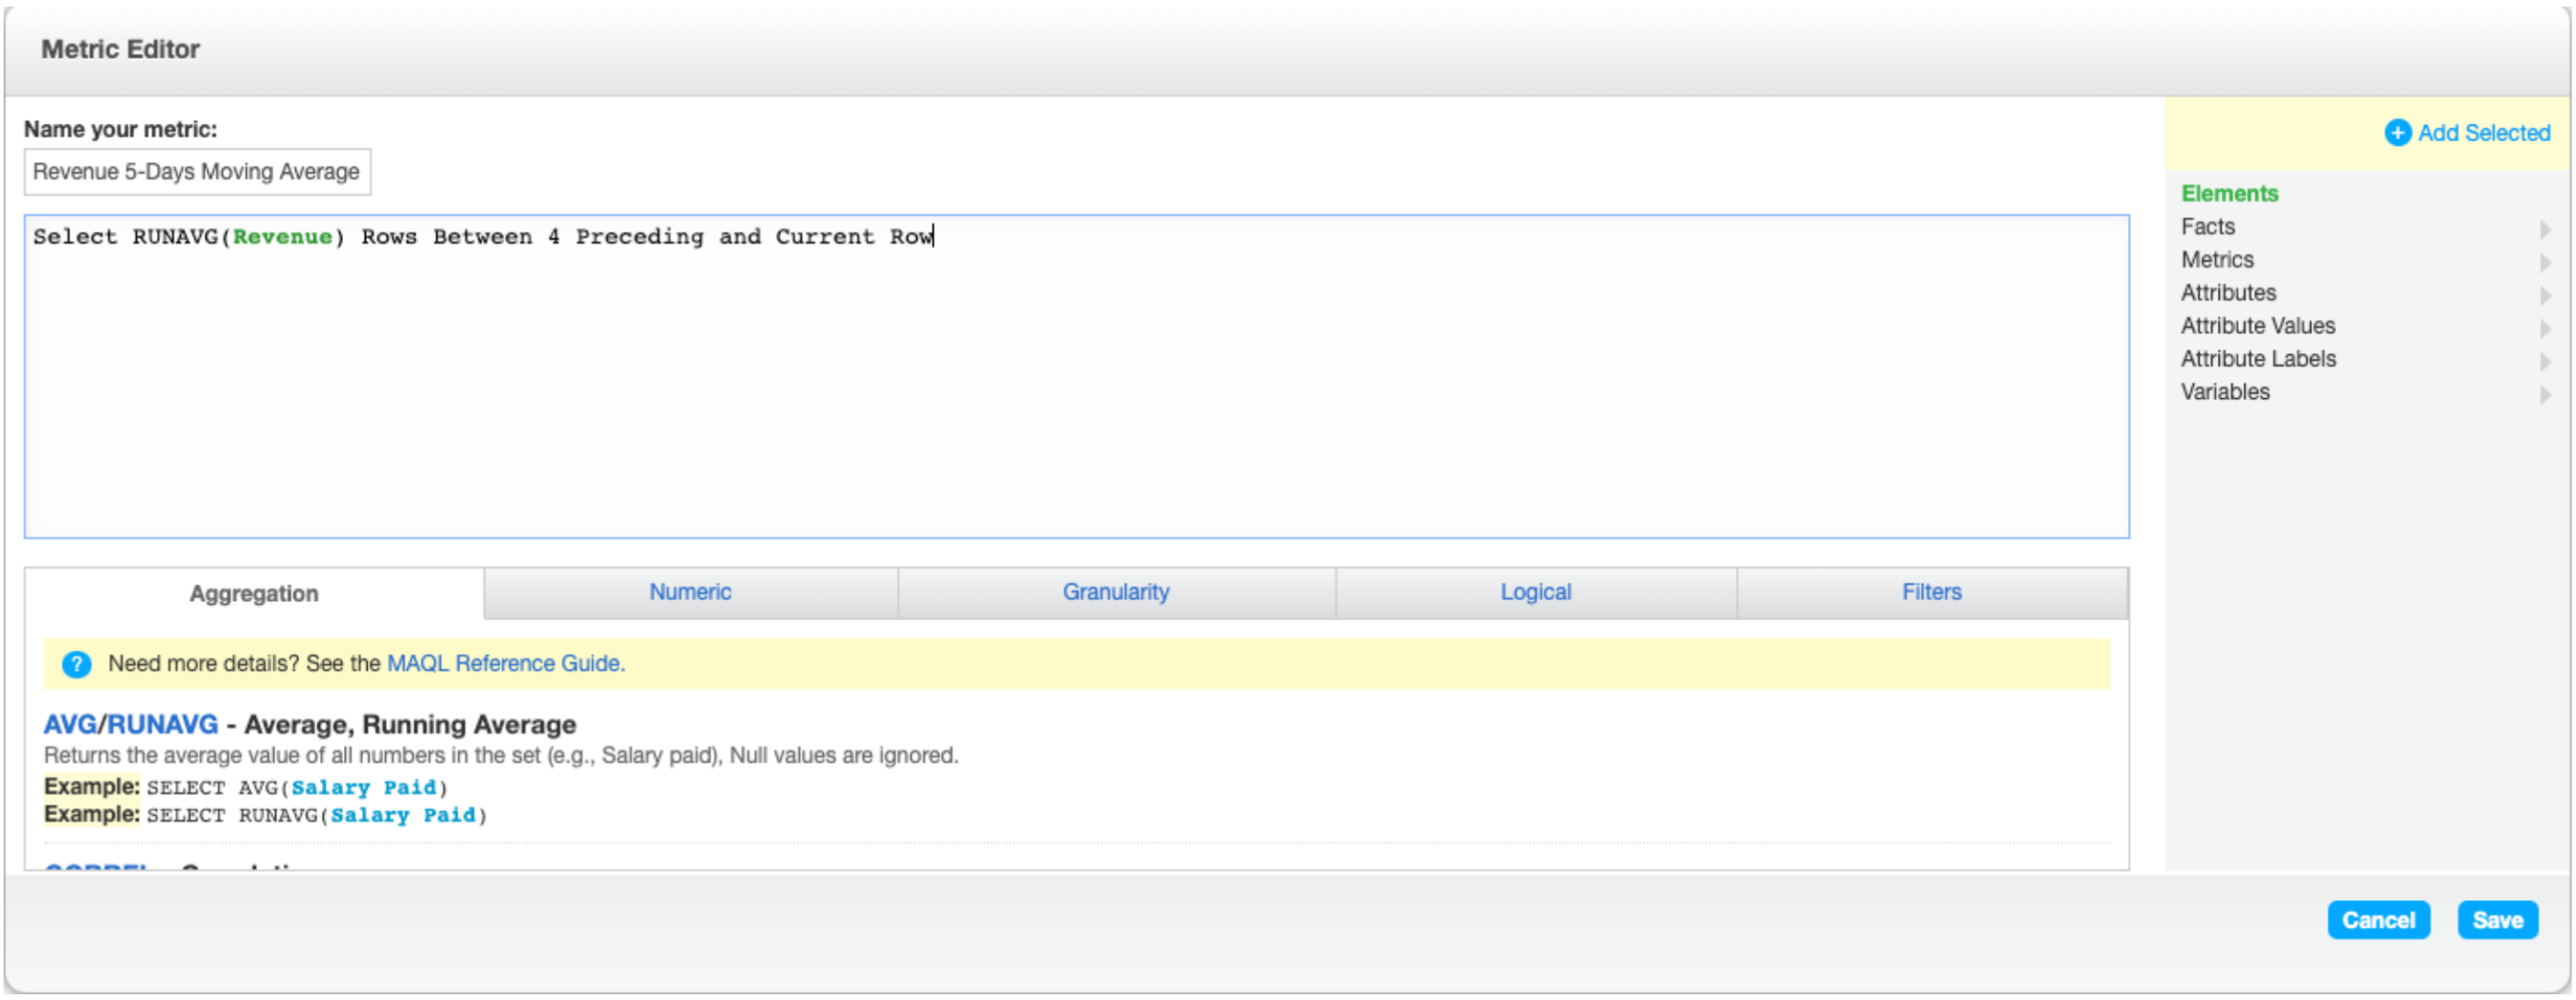
Syntax 4:
SELECT RUNAVG(Revenue) Rows Between 4 Preceding and Current Row
This MAQL query takes the average of revenue defined in Syntax 1 for the last 5 days (including today). Here is what a line chart will look like if we limit the data to only this year:
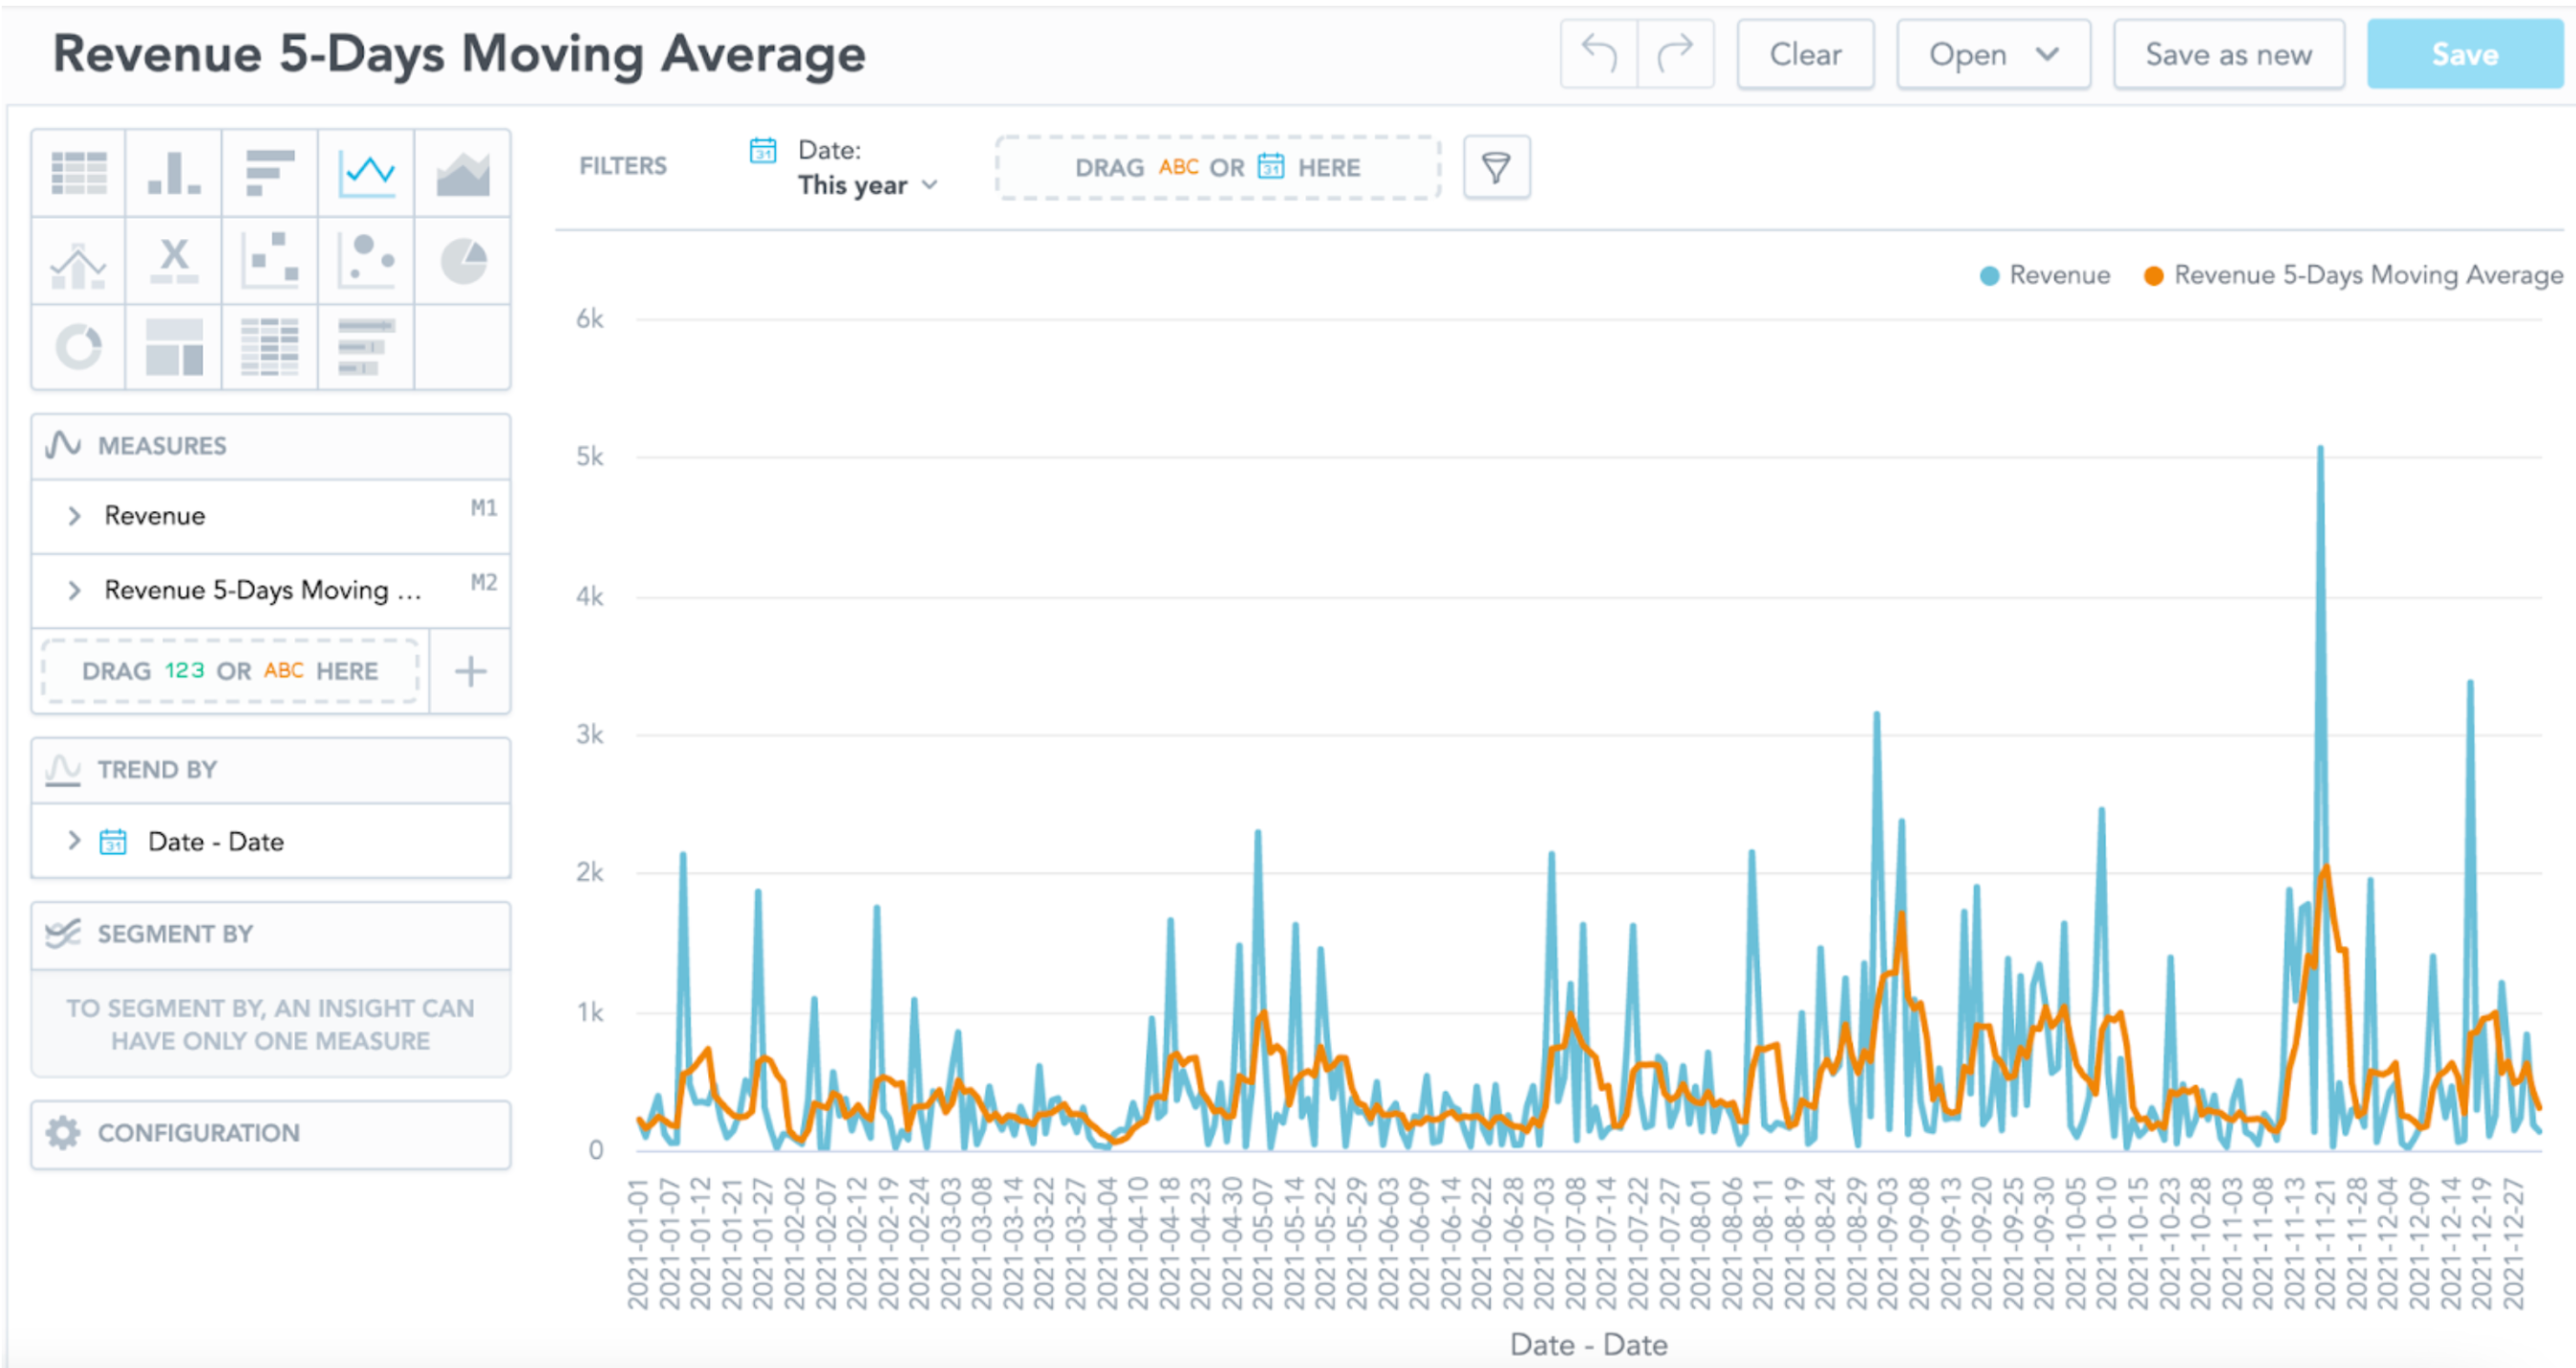
The blue line represents the actual daily revenue, while the orange line represents the 5-Day moving average revenue. As we can see in Diagram 4, the orange line is smoothened and displays the 5-day trend of revenue. You may also combine the within keyword to limit the timeframe within a specific date granularity. If we are interested in obtaining the 5-day moving average using only the same year data, we may modify Syntax 4 to the following:
Syntax 5:
SELECT RUNAVG(Revenue) WITHIN (Year(Date)) Rows Between 4 Preceding and Current Row
Conclusion
Running Total Function is a great way to calculate a metric across a specific time frame. We have explored the difference between sum and runsum and how flexible it is to calculate your metrics with different time frames.
Syntax format:
SELECT RUN___(<metric>) WITHIN (<Date Granularity>) Rows Between ___ and ___ WHERE <attribute/metric/fact> = <some condition>
(Tip) Note on Calculating Moving Average
Going back to our example on calculating Revenue 5-day moving average, you may realize the flaw of the MAQL query in Syntax 5 is that the entries of the first 4 days do not fully take 5 days of average (i.e., the moving average for the entry on Jan 1, 2020 is the same as the revenue), like below:
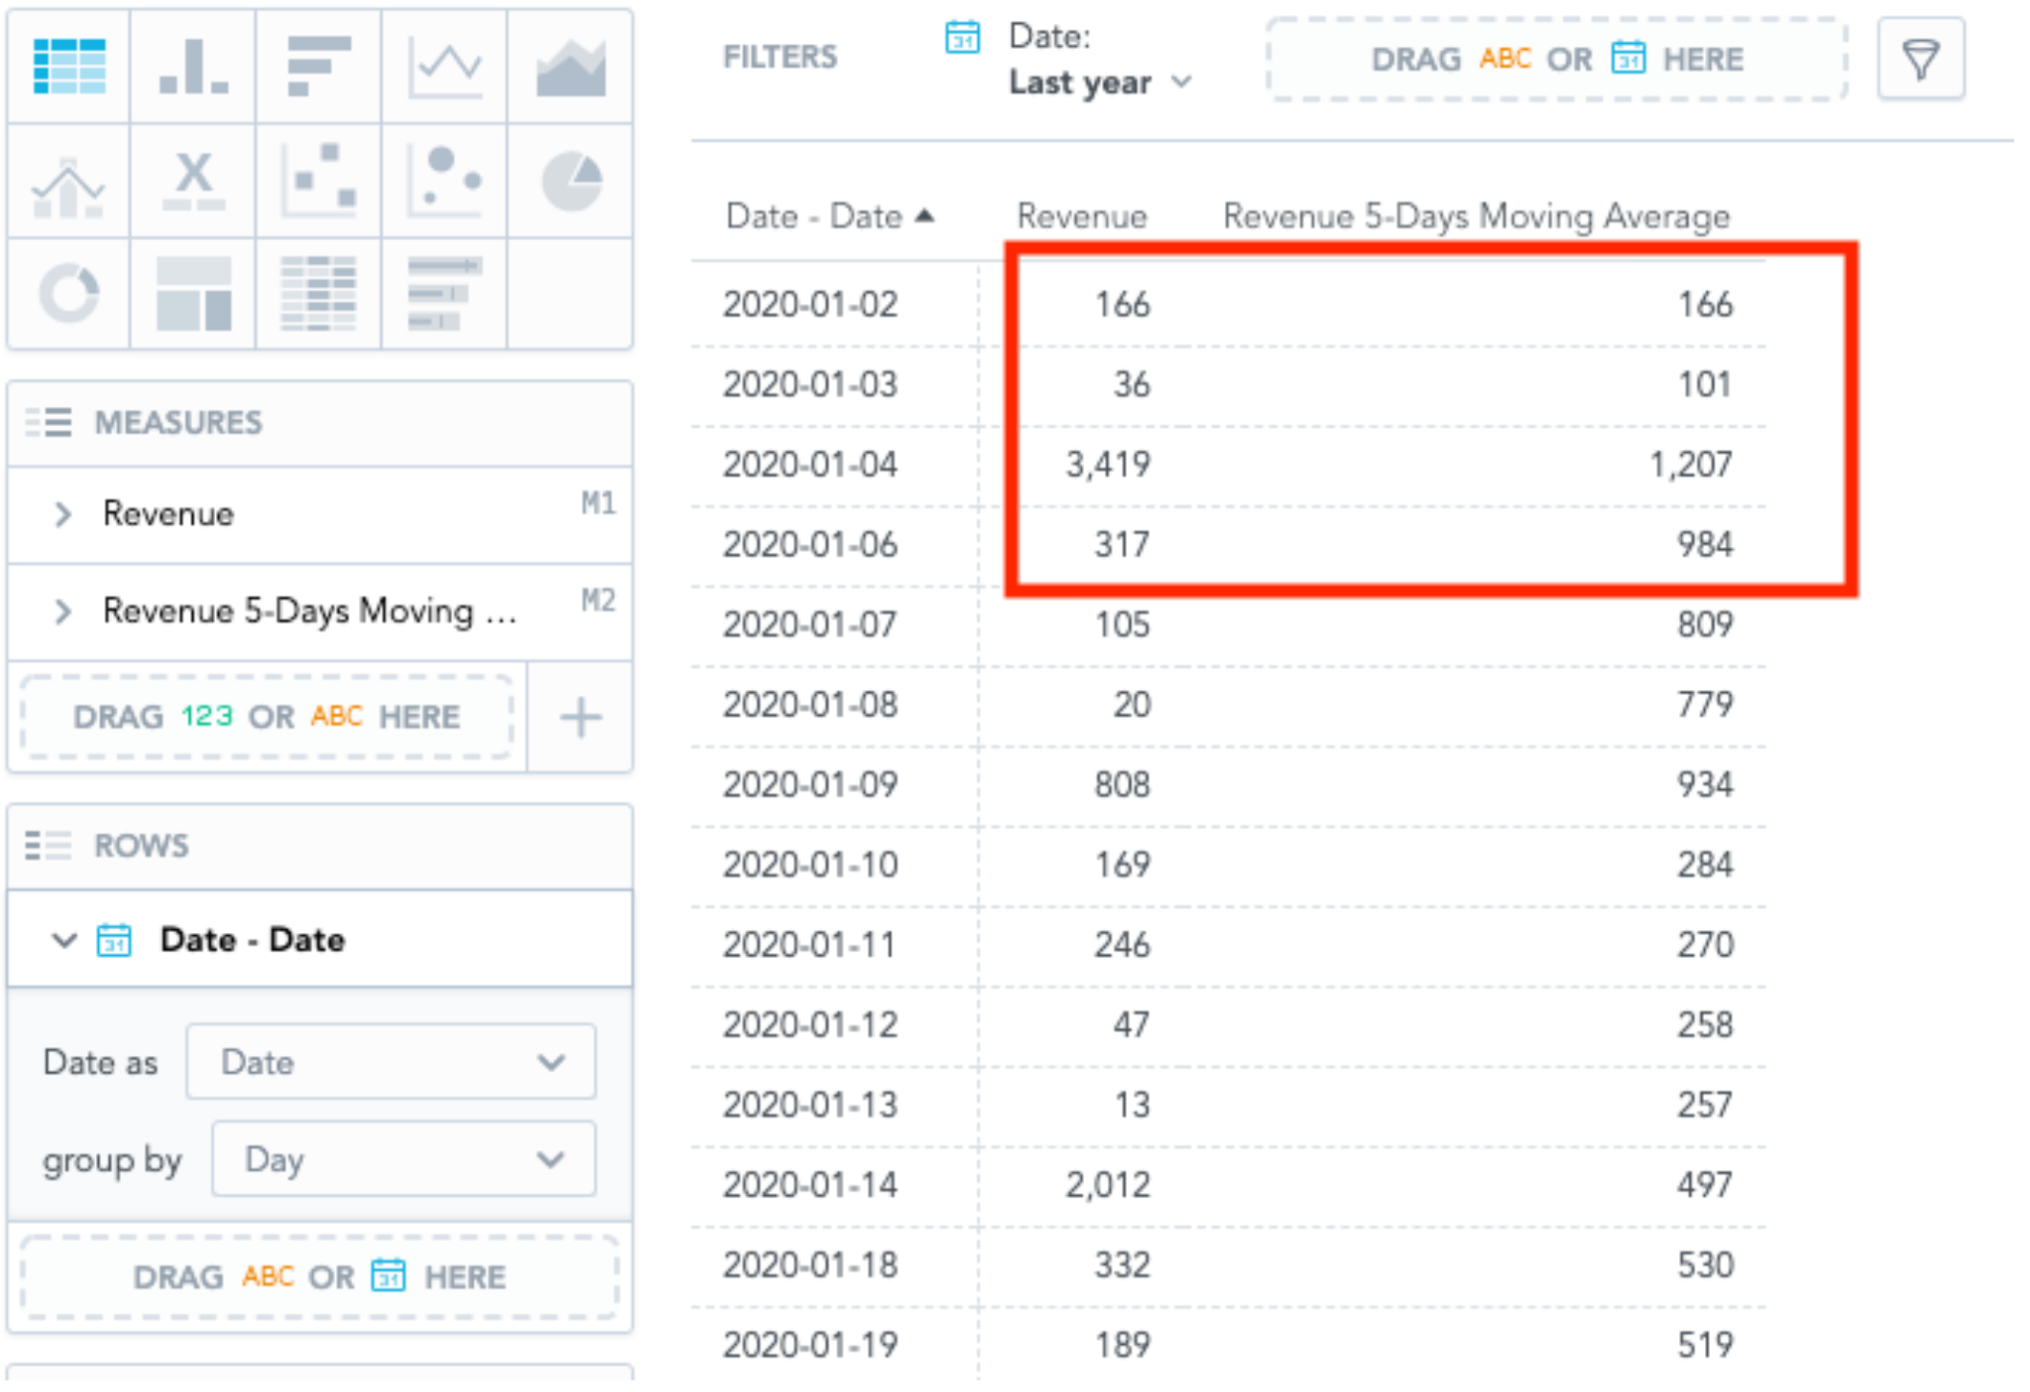
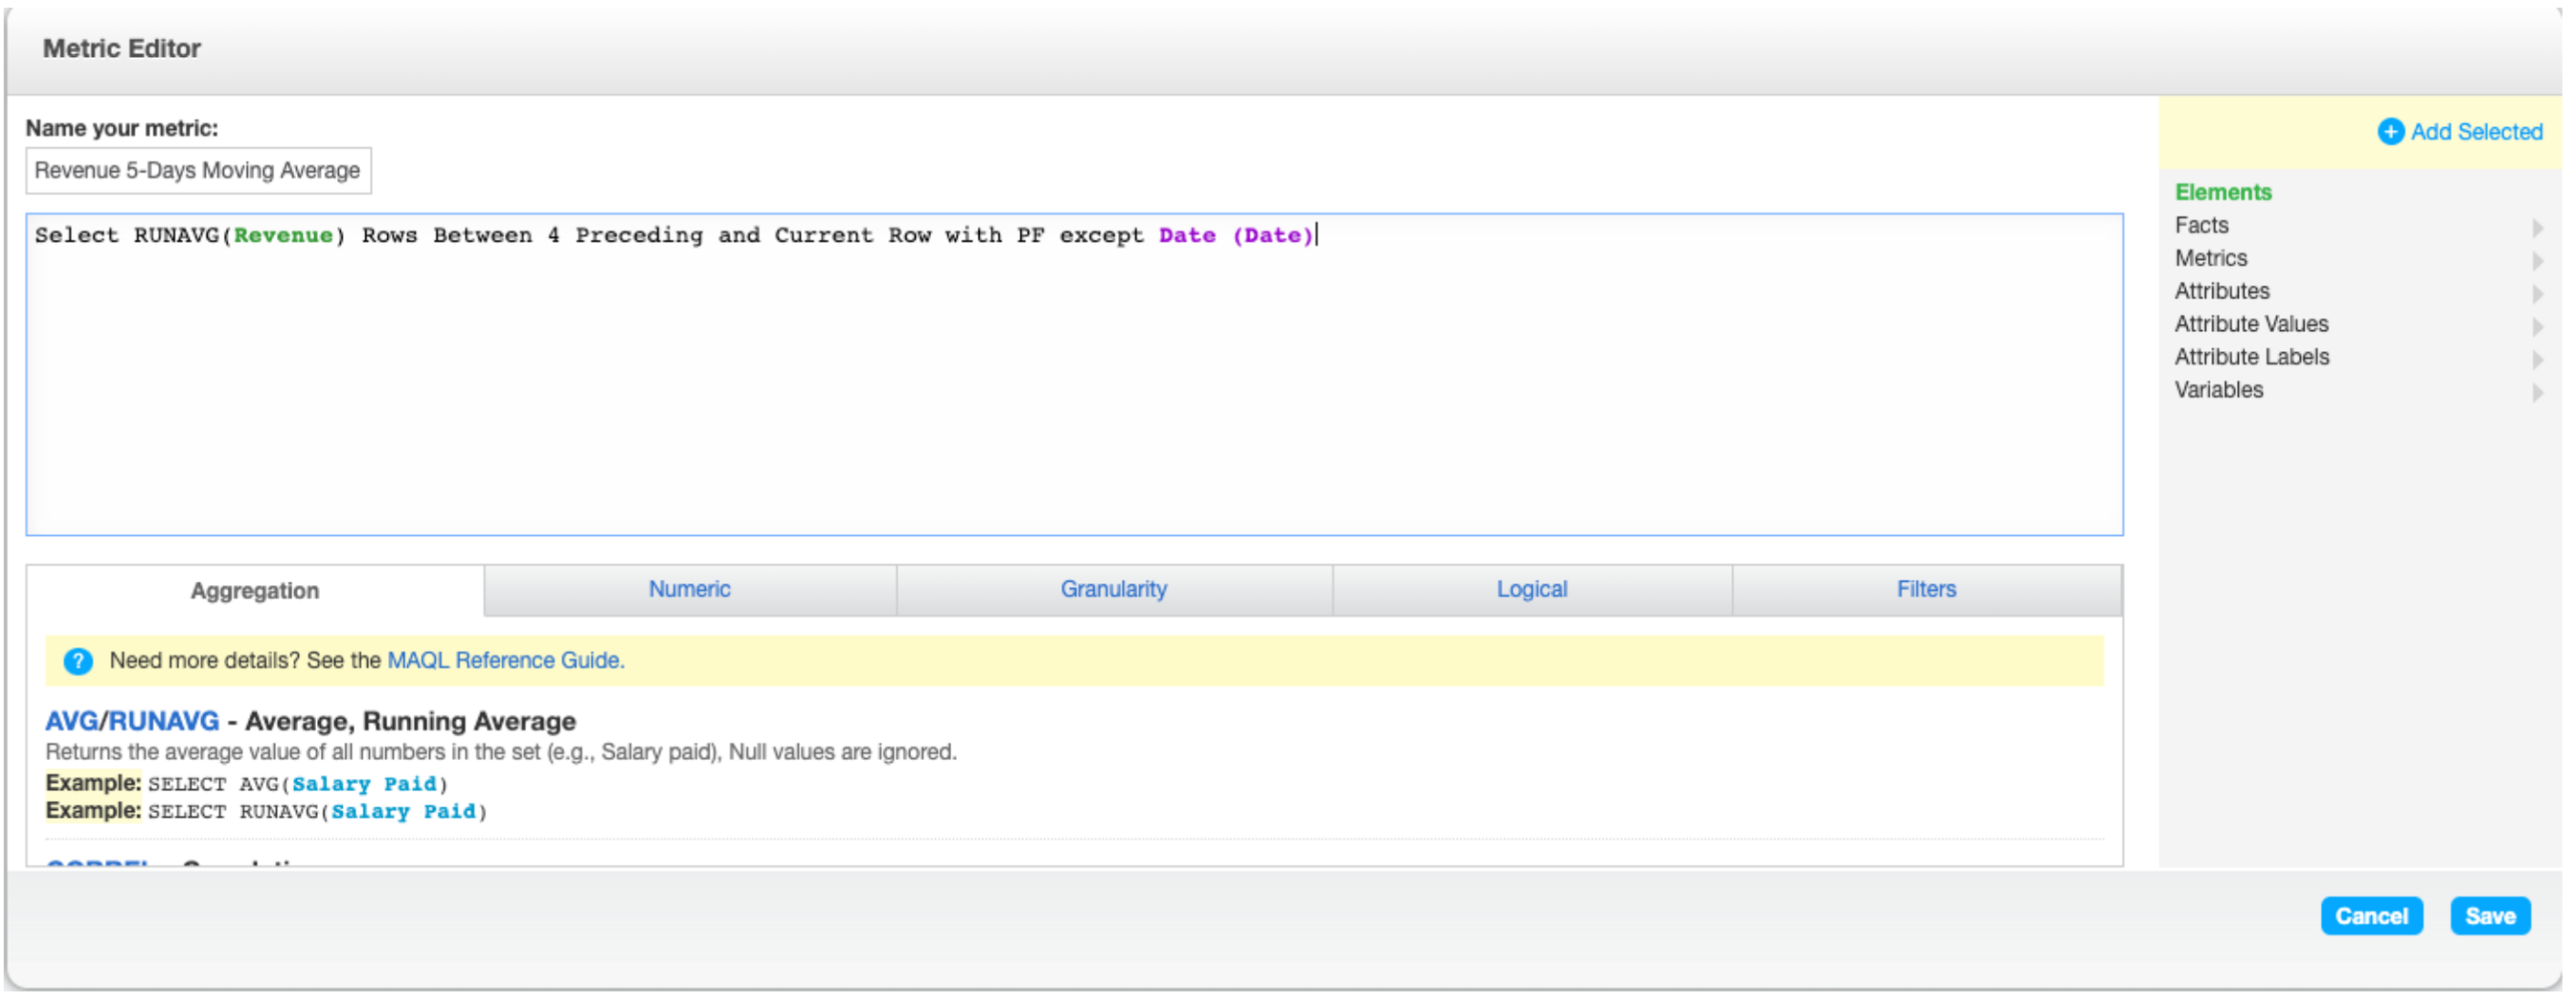
It happens because the entries needed are filtered out. In order to fix it, you need to include “WITH PF Except Date” in Syntax 5, so that the metric is able to include the entries from the previous year in the calculation, with the following Syntax:
Syntax 6:
SELECT RUNAVG(Revenue) Rows Between 4 Preceding and Current Row WITH PF Except Date(Date)
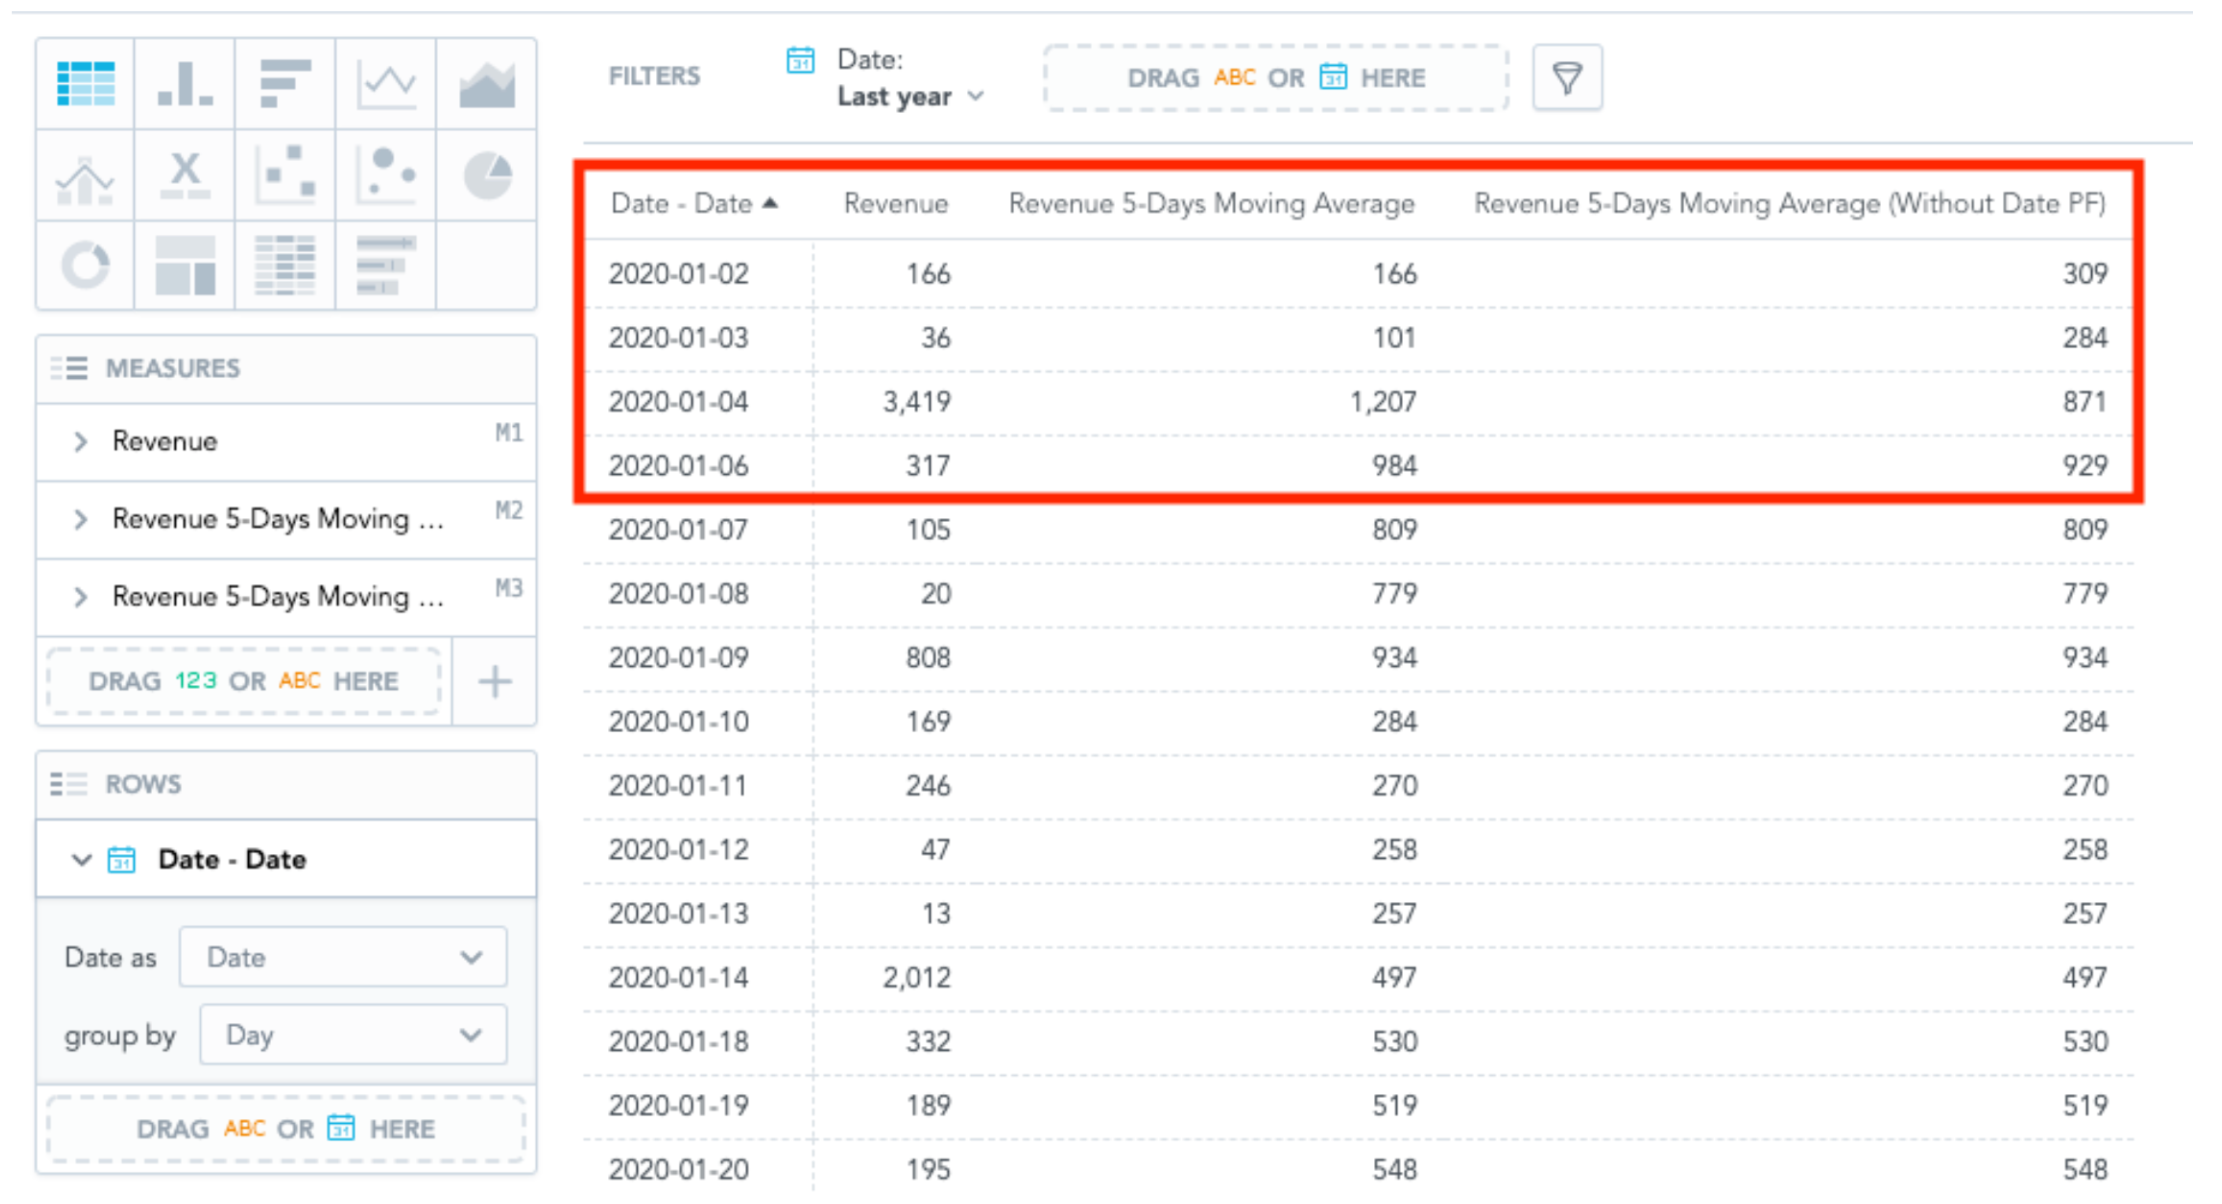
Once you have utilized the new metrics, it will look like this:
Once you have created this insight, be sure to test whether this is the desired metric you would like to display on a dashboard and adjust the filtering dependence between this insight and the dashboard.
Reference
Documentation of Running Total Function: