Understand Logical Data Model
Introduction To Data Model
What is a Logical Data Model?
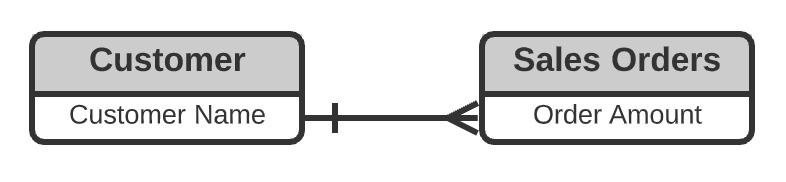
Logical Data Models (LDM for short) are made up of entities—which are the objects or concepts for which you want to track relevant data—and relationships between these entities. For example, a retail business might want to track data about customers and their sales orders. In this example, Customer and Sales Orders are the entities that the business wants to track information about, like the customer’s name or the sales order amount. As a business rule, one Customer can place multiple Sales Orders, but each Sales Order is placed by one specific Customer. This corresponds to a one-to-many relationship in the data model between the Customer and Sales Orders entities. Relationships between entities reflect business rules.
Data models help you simplify reality into something that you can easily work with. The LDM is also easier for report builders to use as it describes the data using terms for business entities and processes that they are familiar with.
The LDM is a key component in each analytical solution based on GoodData. You cannot analyze anything that is not in some way part of the LDM. This course will not teach you all the details of how to design an LDM from scratch, but it will give you an introduction to reading and understanding them, which is a prerequisite for that.
You can also imagine the LDM as an interface between the actual physical data—stored somewhere on a server—and the user who is building or using an insight.
A Sample LDM
In this course, we will be working with a logical data model for a simple retail sales organization. Let’s call it Acme. Acme employs sales managers who sell products to customers. For better tracking, products are marked with tags. Every time something is sold, there needs to be an order for it, and each order can contain multiple products. Once the order is completed, it is shipped to the customer.
Acme is interested in building reports—which are called visualizations in GoodData—such as:
-
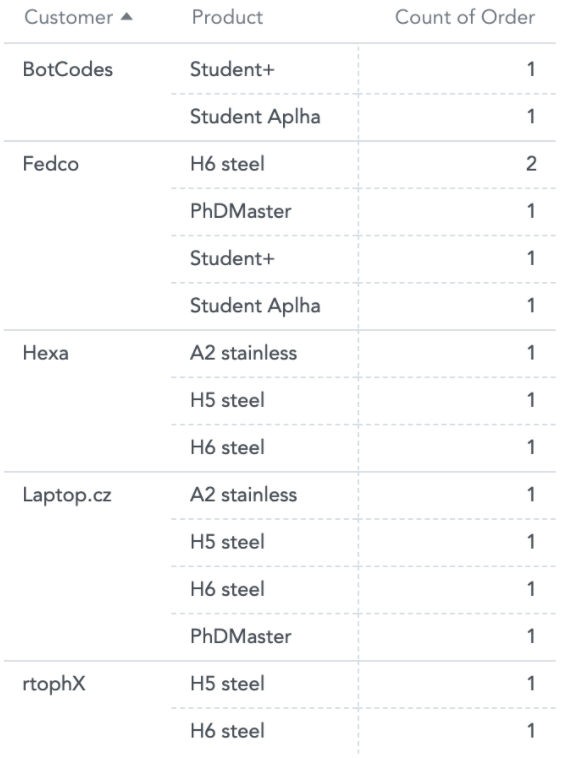
Total number of orders per product and customer
-
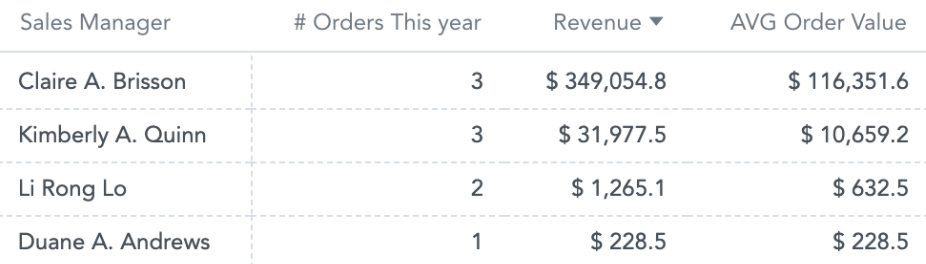
Average order value for each sales manager for the current year
-
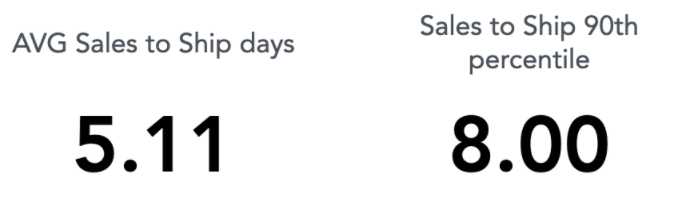
Average time between an order being placed and shipping and the 90th percentile of the same measure
There are of course other processes and measures of interest for Acme. Sales managers get paid, and new ones are hired. The products are purchased and stored in the warehouse. Some customers return goods if they are not happy with them, and so on. But at this point, we are only interested in the sales process, and therefore we will only focus on this part in our LDM.
This kind of simplification is typical for data modeling. We’re capturing just a select part of reality so we can focus on what’s important instead of irrelevant details. This allows us to deliver the analytical solution quickly without overwhelming our users with too much complexity. Of course, the data model is not set in stone, so we can always change it and expand later if there is a need for it, like if we need to add data for the hiring process.
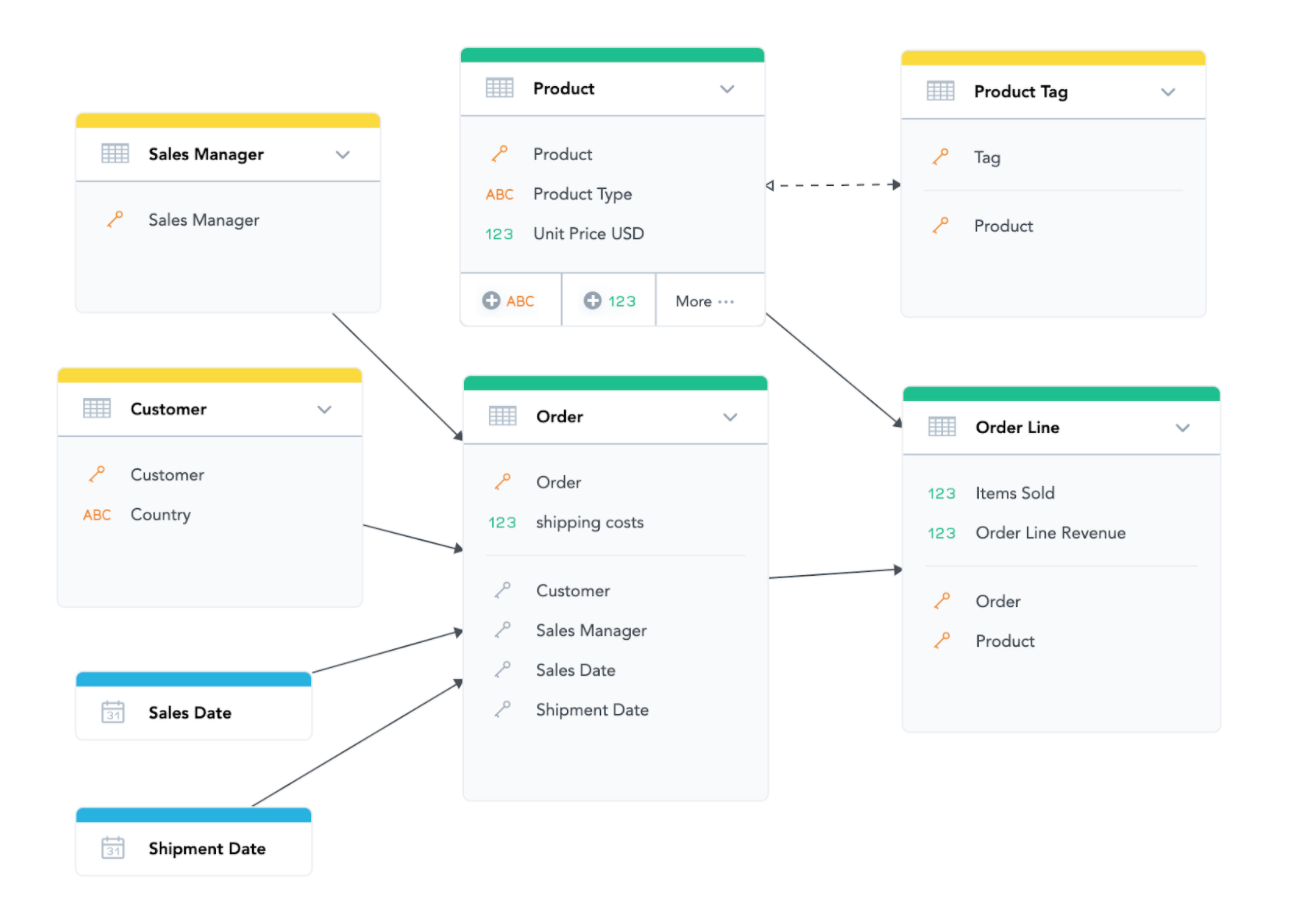
In GoodData, the LDM is represented as a graph with arrows connecting boxes—which we call datasets—into hierarchies. Below is the graphical representation of a logical data model that works for the scenario described in this chapter. As you can see, it contains sales managers, customers, orders, products, and something called order line, which represents each item in the order.
We’ll explain what all the different components are in the next section of this course, but for now, just take a look.
For those of you who would rather see some tangible data to have a better idea of what will be loaded to the model, here is an example of data files that can be loaded to our sample logical data model. For each dataset—a box in the model—there is a table:
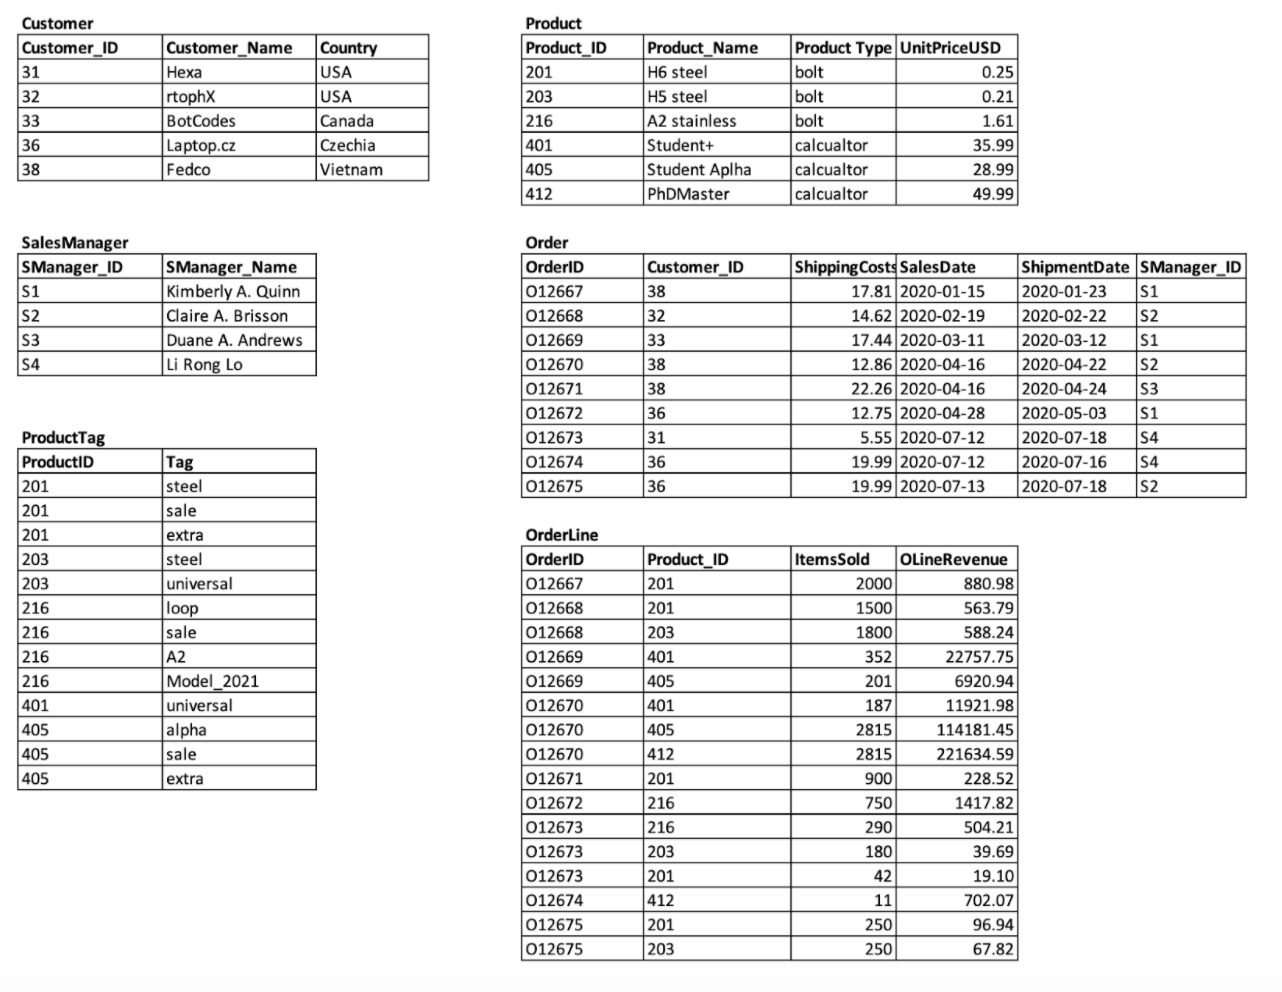
You can also download the data from the “Details” tab on the right side.
What Does LDM Do for You?
Before we dive deeper into the individual components of the LDM, let’s first discuss why the model is important and what benefits it brings you.
While some analytics tools do not require a logical data model (or its equivalent) to be defined, this usually means that every single report requires you to write a separate query (i.e., in SQL or a similar language) or define some kind of mapping to the physical data. With a predefined logical model, you define the mapping and relationships once, and then you can reuse the same objects multiple times for many different reports.
What’s even better is that the data analyst, who has experience with and knowledge of the data, makes sure that the business logic and important relationships are built into the LDM, like that each Order has a Sales Manager (who arranged the deal) and Sales Date (when the contract was signed). This makes it super approachable for anyone who might need to use the data. Even end-users who only understand the business logic but are not familiar with the raw data and don’t have SQL skills can analyze the data over LDM.
If the data model is well-designed, business users do not need to think about how to connect different data points every single time they create a report. All the important relationships are already embedded into the logical data model. Need the total number of orders Acme processed last year? No problem. Need to see it split by month? Sure, one click, and here it is. Do you only want those with a specific product involved? Just a few clicks, and here is the result—no need to write and rewrite joins and aggregations in SQL.
By defining a logical data model, you are unlocking endless possibilities for ad-hoc analysis, even for people who are not trained data analysts and are not 100% familiar with all the details of how the data is structured.
In GoodData, the logical data model and derived measures—which are calculations on top of the data points provided by LDM—form what we call a semantic layer. Each workspace has a single logical data model that defines which data is available for analysis in that workspace and the relationships between different data entities.
This model defines what analysis will be possible to perform—what measures can be created using MAQL and how they can be sliced and filtered.
The logical data model also defines the format for storing data on the server for the analysis engine to query.
In the next section, you’ll learn what the individual components of a logical data model are.