Getting Started with GoodData Cloud
Create Dashboard
Summary
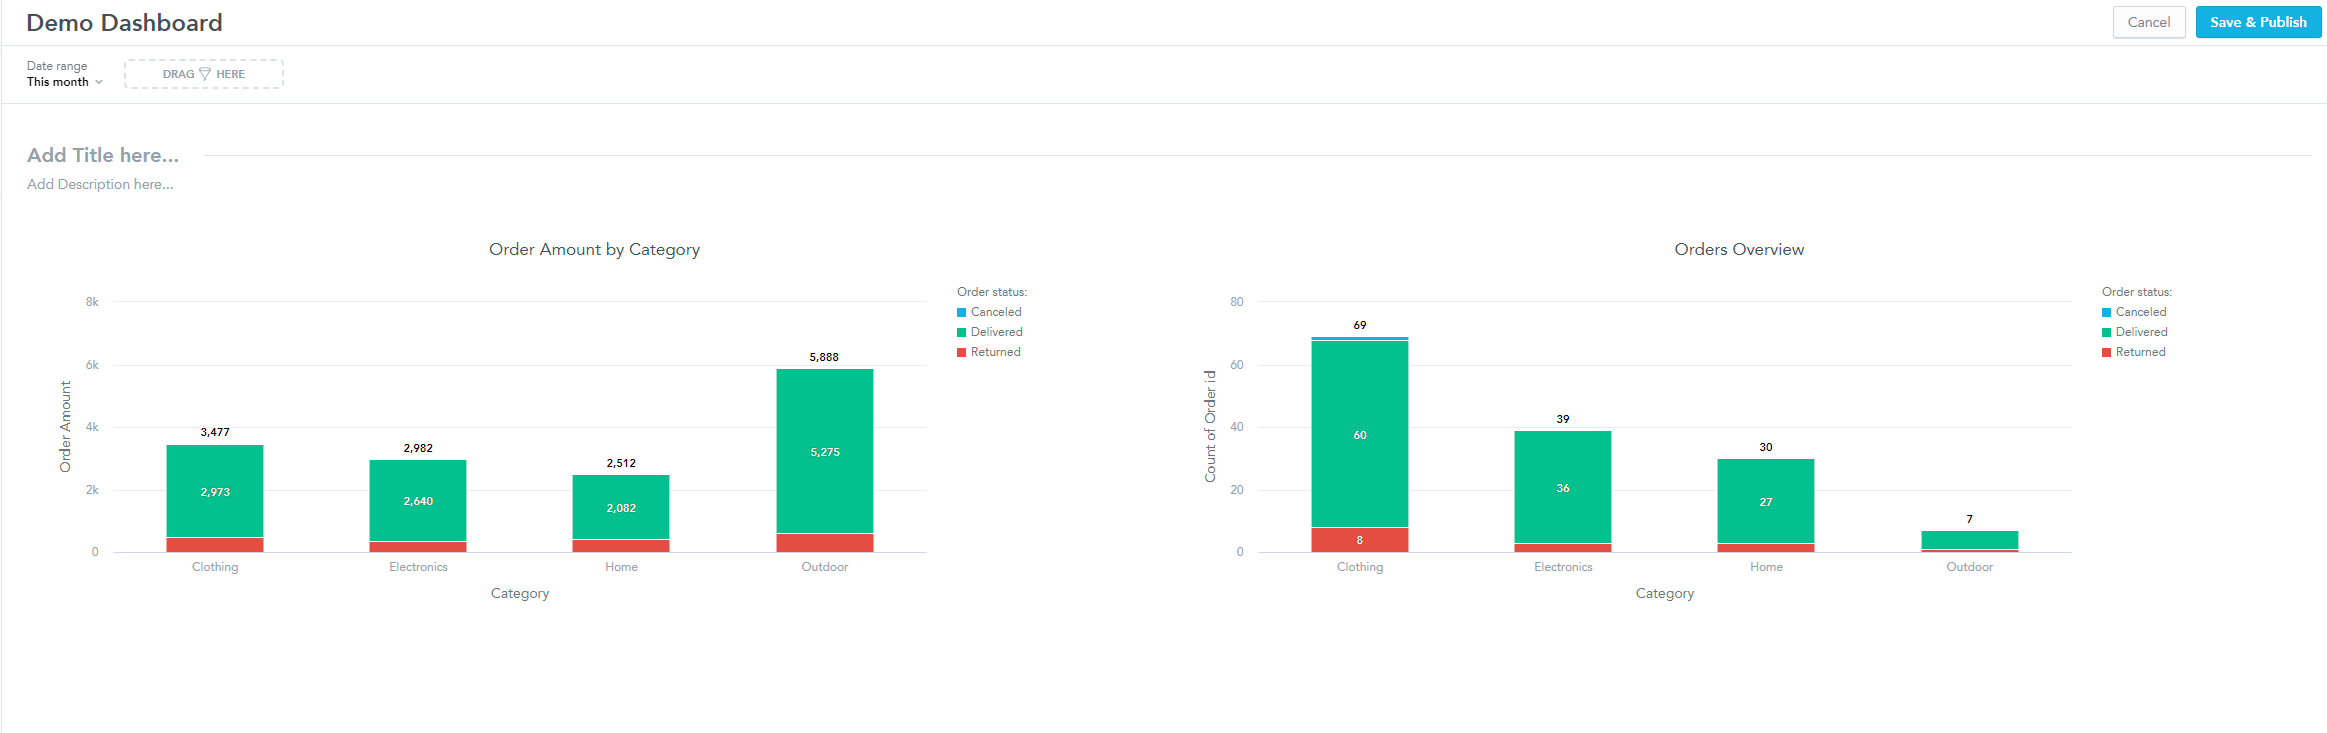
Now let’s compare our two visualizations, that we have created throughout this course.
To create a dashboard:
-
Go to the Dashboards tab.
-
Select Create Dashboard.
-
Drag and drop your two visualizations from the left navigation menu onto the dashboard canvas.
-
Now name your dashboard Demo Dashboard and click Save & Publish.
Good job! You have created your first dashboard!
Setting up Filters
Summary
Another thing you can do on the dashboard is to use Filters.
With filters, you can for example filter out data for a single customer or you can filter only some regions.
To apply a filter:
-
Navigate to a dashboard.
-
Click Edit in the top right corner.
-
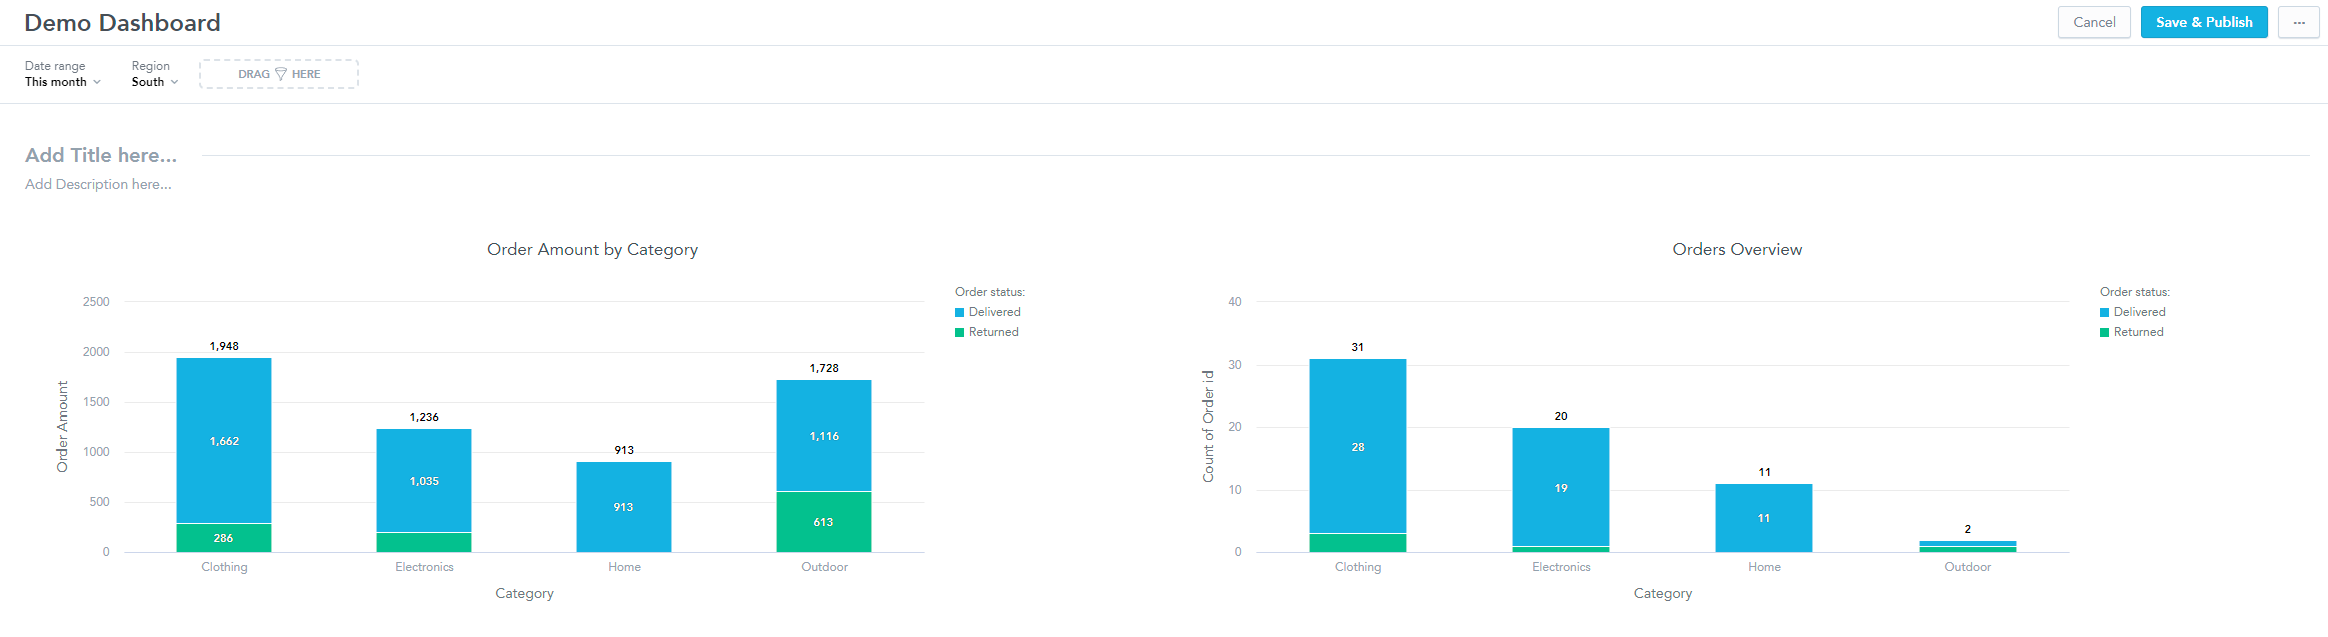
Drag and drop an Attribute Filter form the left navigation menu.
-
Apply the filter by selecting an attribute to filter by.
In our case we filtered by Region and selected South.
-
Click Save & Publish
Good job! Now you know how to use filters in GoodData!