Designing Data Models
Data Model Examples
Source Data
Throughout this course, we will work with the following source data.
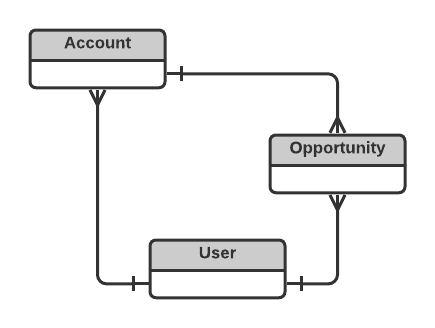
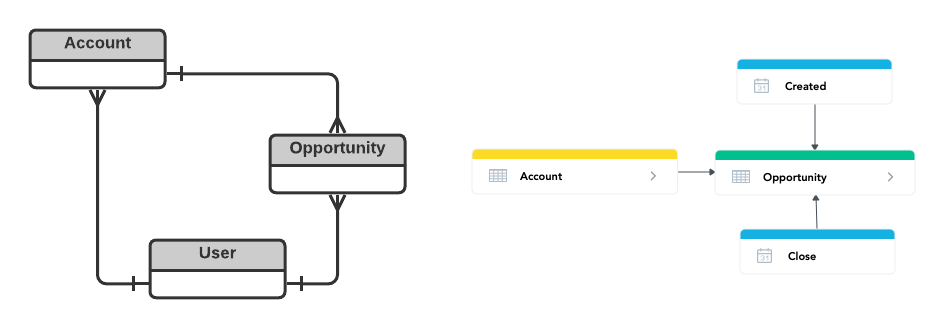
The Account table stores data on the companies you sell to (or would like to sell to). The Opportunity table stores all sales opportunities. Each account can be associated with multiple opportunities; imagine you sell different products or the same product on multiple occasions. Both the Account and Opportunity tables are connected to the User table. This table stores information about your salespeople, who can be in the roles of Account Owners and Opportunity Owners.
The crow’s foot notation expresses that a User can own many (but also no) Accounts and Opportunities. The Account Owner can be different from the Opportunity Owner, even if the Opportunity belongs to the same Account.
Normalized Model
Let’s look at the table columns. Ids are the primary keys. AccountId and the two OwnerIds are the foreign keys.
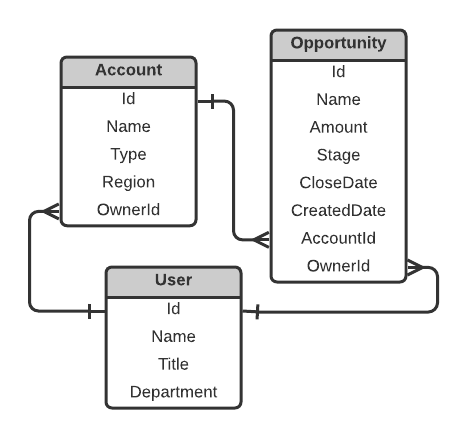
This source data model is in the third normal form (3NF), which is great for operational databases. It perfectly handles single operations like creating a new user, changing the status of an opportunity, changing the Account Owner, and many others.
Star Schema
We want to create a data model that works well for analytical use cases. That totally changes the semantics of the model. We also transition from the 3NF to a dimensional model: a star schema. The schema above is not a star schema. If nothing else, a star schema with three tables has to have precisely two relationships (this schema has three), and only one table (the fact table) includes foreign keys (both Account and Opportunity have foreign keys in this schema).
To build a star schema, we have to understand the business requirements. We will start with simple business questions and propose a data modeling solution for each.
Single-Dataset Models
How much do we sell? Can’t we just run a simple SELECT SUM(Amount) in SQL and be done? That argument is valid when you need just that one number right now. But what if it’s better to show trends by month or quarter? We may also want to drill down to Opportunity Owners and compare them, or we could be interested in the number of opportunities instead of just the Total Amount. In just a moment, we will start listing all the potential queries that can be easily executed in a simple star schema.
Single-Dataset Model
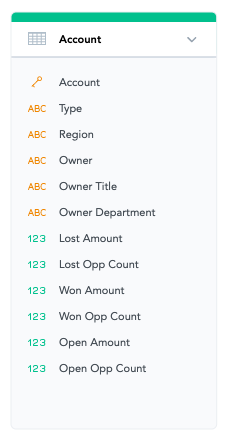
Looking at our source data model, we can skip the Account table altogether. Nothing in our requirements touches anything in the Account table. Simplification is crucial; identify columns, tables, or relationships that are not relevant and remove them. Our dimensional model can consist of a single dataset with two date dimensions.
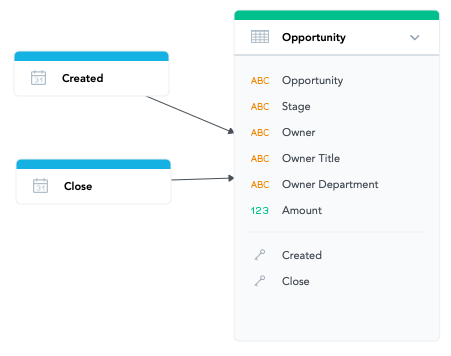
We removed the Account information completely and merged the User information with Opportunity. Opportunity ID is still the primary key, but we call the attribute just Opportunity. It combines both Opportunity ID and Name. We will use the same concept for the Account (Account ID and Name) and Owner (User ID and Name). More on that in a bonus lesson at the end of this course.
Aggregated Dataset
When we know we don’t need to drill down to specific opportunities and only need to answer the questions described earlier, we can end up with a different dataset. A single aggregated dataset is enough to answer and visualize our questions.
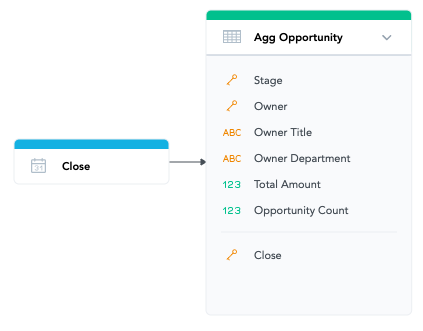
Close Date, Stage, and Owner Name are now the composite primary key or table grain. We omit both the ID and Name for the opportunities (and also the Created Date). For each combination of these three columns, we have at most one record in the dataset, showing Total Amount and OppCount for the specific Opportunity Close Date, Opportunity Stage, and User in the role of Opportunity Owner.
Note: If you know you only care about the quarter in which the opportunity was closed, you can aggregate the Opportunity Close Date to quarters.
Business Requirements
Although we removed so much information from the original data, we can still answer many business questions. The insights we can build with this super simple data model are, for example:
- Total amount of won opportunities
- Amount trend by year, quarter, or month
- Difference between this quarter and the previous quarter, or this quarter and the same quarter last year, in absolute numbers or in percents
- Total amount by sales reps (opportunity owners)
- Top- and bottom-performing sales reps
- Sales rep performance trend over time
- All of the above but showing the number of opportunities instead of the amount
- All of the above but showing the average opportunity amount
- Opportunity distribution by sales reps historically and for open opportunities
- Forecasts by quarter by sales rep
- Pipeline health by opportunity stages
- What percentage of all opportunities are won
With just a single dataset and the most straightforward data model, you can discover critical information about your business: that your business is growing but the average opportunity value is decreasing, that one group of your sales reps has double the number of opportunities than another but performs the same or worse.
Transformations and Data Changes
Where do we sell? That is another important question. Let’s look at the Account Owners and their Accounts. Which accounts have open opportunities? Are these new accounts, or did we try to sell them in the past, and did we succeed?
More Transformations
In the previous lesson, we ended up with one dataset where the data was transformed, joined from two tables, and aggregated. We can use the same approach here.
There are multiple reasons why you’d opt for this transformation-heavy approach:
- Data volume: why store all that granular data when no one ever uses it?
- Performance: the more you precalculate, the faster the insights are
- Security: you don’t want to give users visibility into more granular data
- Ease of use: the simpler the data model is, the easier it is to use
In this case, the data model would again be just one dataset:
What information do we lose with this aggregation? For open opportunities, it is their stage. Without the stage, you are losing essential insights into the sales funnel. The most important missing information for open and closed opportunities is their Close Date. Without the Close Date, you don’t know when to expect open opportunities to be won. In addition, the account where the last won (or lost) opportunity is three years old will have different dynamics than an account where the last opportunity was closed a month ago.
Fewer Transformations
As a rule of thumb, the transformation-heavy approach is the right one. But in this case and for the reasons above, we advocate for a less transformation-heavy approach with the full Opportunity table:
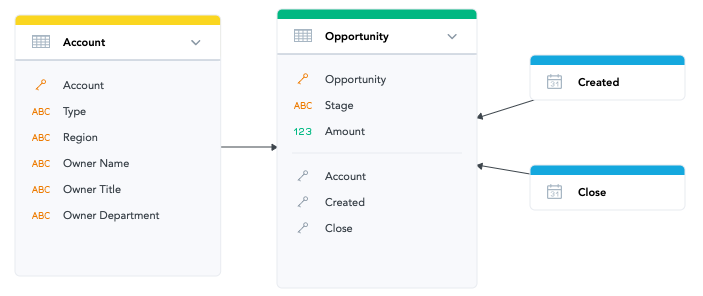
The reason for this approach is flexibility. The number of insights you can create within this data model, thus your analytical power, is much larger than the previous data model.
Looking at this data model alongside the original one, they look very similar.
The Account and User tables are merged. What is missing is the relationship between Opportunity and User; we don’t know who the Opportunity Owners are.
Data Changes
Did we lose any information with the merge operation? The answer is not a simple yes or no, as it depends on how we load the data.
Imagine this situation:
User Table
| Id | Name | Title | Department |
|---|---|---|---|
| 1 | Jane Doe | Account Executive | Sales |
| 2 | John Smith | Account Executive | Sales |
Account Table
| Id | Name | Type | Region | OwnerId |
|---|---|---|---|---|
| 1 | Acme | Enterprise | East Coast | 1 |
| 2 | Blast | Non-Profit | East Coast | 2 |
This is our operational database, so let’s perform some operations. We’ll promote Jane to Director and give her ownership of both Acme and Blast. The changes are marked in yellow.
User Table
| Id | Name | Title | Department |
|---|---|---|---|
| 1 | Jane Doe | Director | Sales |
| 2 | John Smith | Account Executive | Sales |
Account Table
| Id | Name | Type | Region | OwnerId |
|---|---|---|---|---|
| 1 | Acme | Enterprise | East Coast | 1 |
| 2 | Blast | Non-Profit | East Coast | 1 |
When loading the data to the dimensional model, we have two options:
- We can update everything. In this case, we will keep exactly the same information about Accounts and Users as in our source database.
- We can update only the changes. In this case, Jane’s job title would be Director for Blast but still Account Executive for Acme.
What to do depends on your use case. Here, it makes sense to overwrite the job title to Director everywhere, but there are situations when it is preferred to keep the original values. By merging the two tables, we move away from the 3NF and introduce inconsistencies. This is one of the features of dimensional data models.